Commercial Land
3391 Ernest W Barrett Parkway Northwest Marietta, GA 30064
3391 Ernest W Barrett Parkway Northwest Marietta, GA 30064
Details & Description
Property Highlights
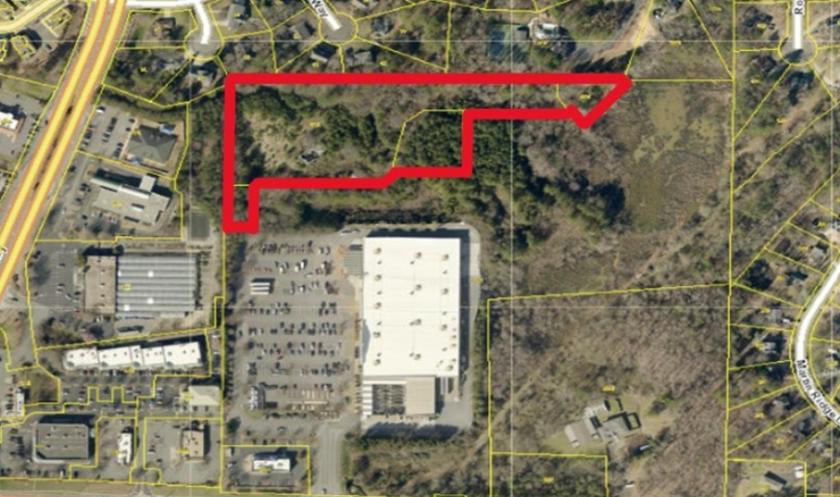
- • Access from Dallas Hwy and Barrett Pkwy
- • Signalized access and sewer on site
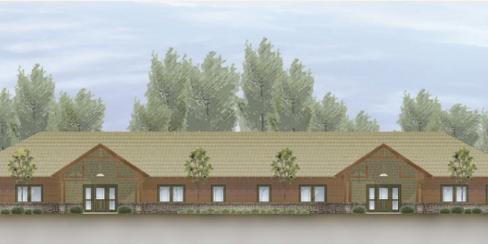
- • Great for mini warehouses, activity centers
Listing Agents

Donald Edwards Jr.
O: 678-298-1622
M: 770-324-3457
don@dbeproperties.com
O: 678-298-1622
M: 770-324-3457
don@dbeproperties.com
While we strive to provide the most accurate information, all listing information, and demographic data, is provided by third-parties. As such, MyEListing will not be responsible for the accuracy of the information. It is strongly recommended that you verify all information with the listing agent, and any relevant agencies, prior to making any decisions.