Office Space
6941 Highway 92 Woodstock, GA 30189
6941 Highway 92 Woodstock, GA 30189

Details & Description
Property Highlights
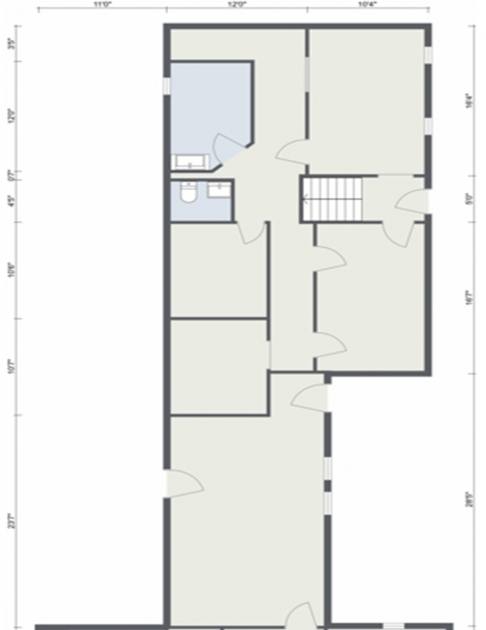
- • Possible medical clinic
- • Single Tenant Suites Available
- • Recently Remodeled
- • 41,600 traffic count
- • 492-1100 sqft available
- • Pricing varies
Additional Photos


Listing Agents

Donald Edwards Jr.
O: 678-298-1622
M: 770-324-3457
don@dbeproperties.com
O: 678-298-1622
M: 770-324-3457
don@dbeproperties.com
While we strive to provide the most accurate information, all listing information, and demographic data, is provided by third-parties. As such, MyEListing will not be responsible for the accuracy of the information. It is strongly recommended that you verify all information with the listing agent, and any relevant agencies, prior to making any decisions.


