Industrial Properties
111 Public Drive Murfreesboro, TN 37127
111 Public Drive Murfreesboro, TN 37127

Details & Description
Property Highlights
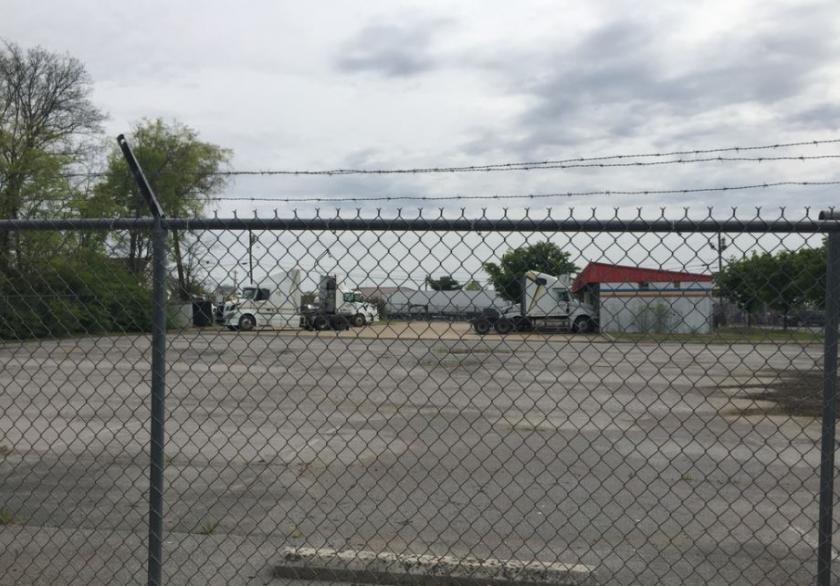
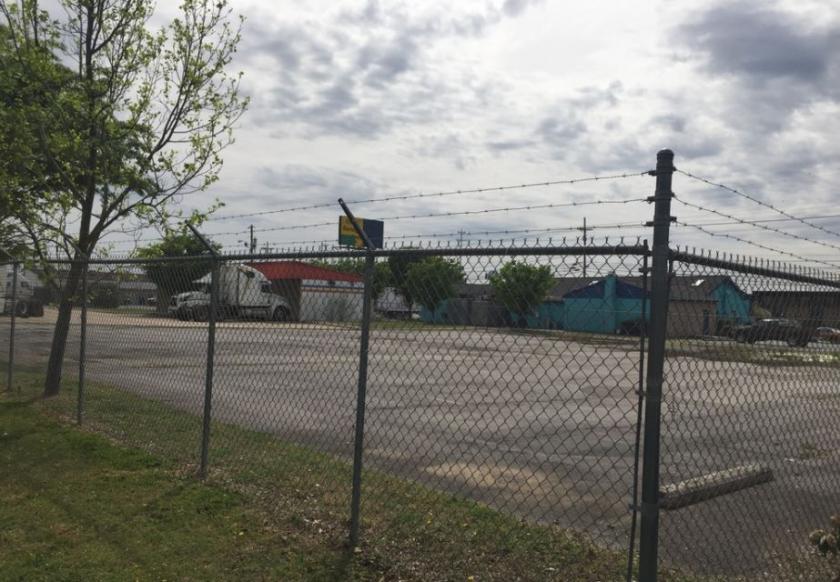
- • Gated access from both sides of the property.
- • Close Proximity to I-24.
- • Small building on site for storage needs.
Additional Photos

Listing Agents

Chris Canary
O: 615-895-8000
M: 615-631-6459
chrislcanary@gmail.com
O: 615-895-8000
M: 615-631-6459
chrislcanary@gmail.com
While we strive to provide the most accurate information, all listing information, and demographic data, is provided by third-parties. As such, MyEListing will not be responsible for the accuracy of the information. It is strongly recommended that you verify all information with the listing agent, and any relevant agencies, prior to making any decisions.


