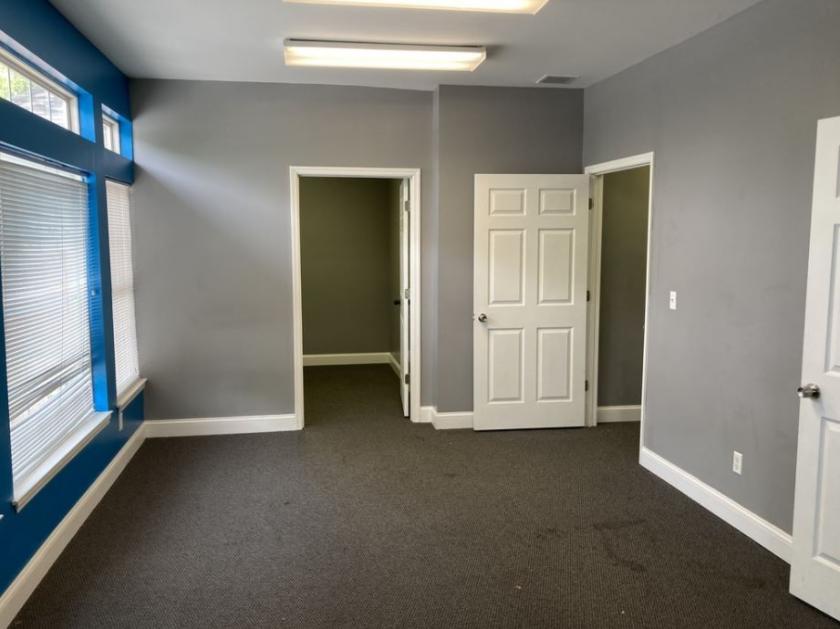
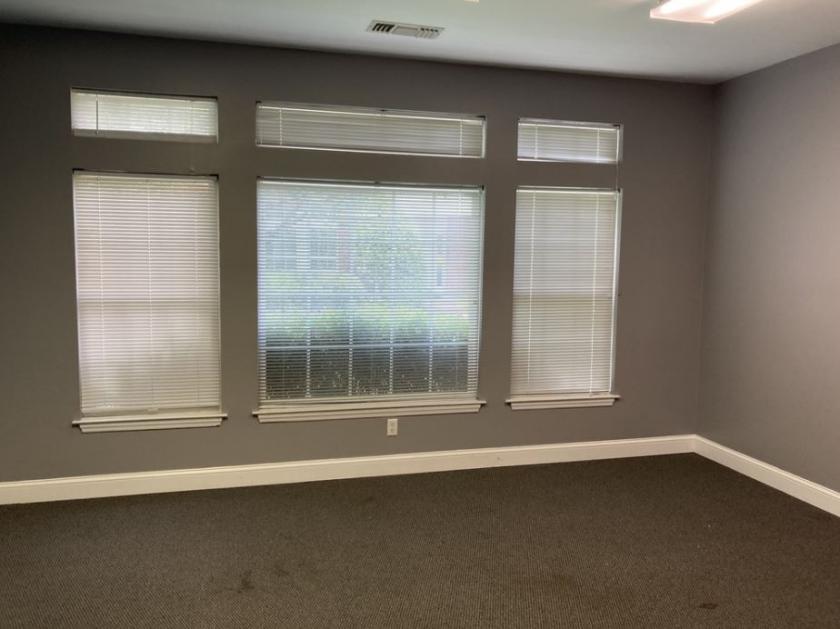
1-Mile | 3-Miles | 5-Miles | ||
---|---|---|---|---|
Total Population | 5,591 | 42,049 | 103,219 | |
Population Median Age | 36 | 34 | 34 | |
Population by Age | 0-9 Yrs | 818 (14%) | 4832 (11%) | 12269 (11%) |
10-19 Yrs | 587 (10%) | 5734 (13%) | 14236 (13%) | |
20-29 Yrs | 1234 (22%) | 11449 (27%) | 25179 (24%) | |
30-39 Yrs | 598 (10%) | 4986 (11%) | 13636 (13%) | |
40-49 Yrs | 599 (10%) | 4744 (11%) | 12759 (12%) | |
50-59 Yrs | 723 (12%) | 4174 (9%) | 10706 (10%) | |
60-69 Yrs | 547 (9%) | 3167 (7%) | 7433 (7%) | |
70+ Yrs | 485 (8%) | 2964 (7%) | 7000 (6%) | |
Median HH Income | $49,561 | $45,527 | $54,648 | |
Total Household Income | < 24K | 472 (22%) | 3902 (25%) | 7458 (19%) |
25-49K | 593 (28%) | 4661 (30%) | 9869 (25%) | |
50-74K | 366 (17%) | 2924 (18%) | 7731 (20%) | |
75-99K | 252 (11%) | 1595 (10%) | 5075 (13%) | |
100-199K | 297 (14%) | 1984 (12%) | 6565 (17%) | |
200K+ | 134 (6%) | 465 (2%) | 1402 (3%) | |
Highest Education Level | No Diploma | 448 | 2830 | 5433 |
Diploma or GED | 886 | 6418 | 15722 | |
Some College | 715 | 5562 | 14650 | |
Assoc. Degree | 229 | 1568 | 4683 | |
Bachelors Degree | 773 | 5236 | 14249 | |
Higher Degree | 432 | 2447 | 6562 | |
Total Housing Units | 2,264 | 17,179 | 41,266 | |
--Owner-Occupied | 1,215 | 6,924 | 19,108 | |
--Renter-Occupied | 898 | 8,608 | 18,991 | |
Owner-Occupied Values | < 100K | 72 | 655 | 1414 |
100-199K | 552 | 3042 | 7584 | |
200-299K | 347 | 2019 | 6443 | |
300-399K | 124 | 755 | 2347 | |
400-499K | 65 | 224 | 760 | |
500K+ | 55 | 229 | 559 | |
Total Working Age Population | 4,515 | 35,186 | 83,783 | |
In Work Force | 3,037 | 23,533 | 59,168 | |
Not In Work Force | 1,478 | 11,653 | 24,615 | |
Workforce Employed | 2,848 | 22,032 | 55,921 | |
Workforce Unemployed | 186 | 1,471 | 3,087 | |
Civlian Workforce | 3,034 | 23,503 | 59,008 | |
Military Workforce | 3 | 30 | 160 | |
Total Households | 2,113 | 15,532 | 38,099 | |
Family Households | 1,263 | 8,488 | 22,657 | |
Non-Family Households | 850 | 7,043 | 15,442 | |
Married Couple | 819 | 5,342 | 15,506 | |
Other Family | 444 | 3,147 | 7,151 | |
Married w/Child | 264 | 2,038 | 6,613 | |
Single Male w/Child | 37 | 351 | 787 | |
Single Female w/Child | 207 | 1,223 | 2,992 |
Population Change Last Two Decades - Plus Projection
2000 | % | 2010 | % | 2020 | % | 2030 | |
---|---|---|---|---|---|---|---|
Tennessee | 5,689,283 | +12 | 6,346,105 | +9 | 6,886,369 | +7 | 7,393,069 |
Rutherford County | 182,023 | +44 | 262,604 | +30 | 341,000 | +24 | 422,589 |
Total Working Age Population:
Total Households:
Total Working Age Population:
Total Households:
Total Working Age Population:
Total Households: