Office Space
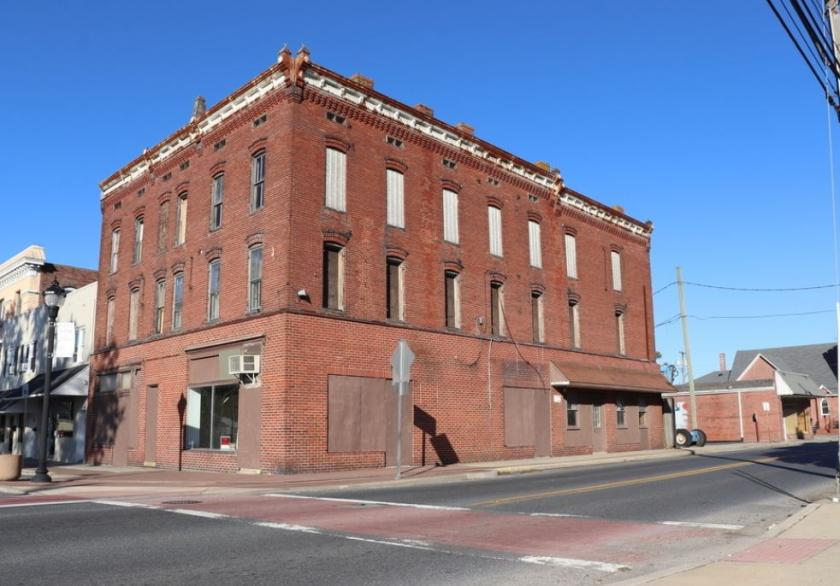
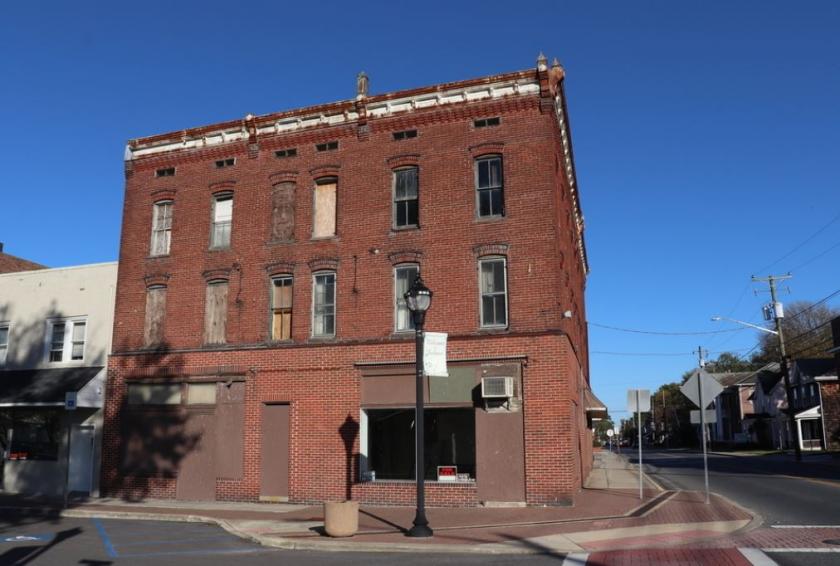
2 North Pennsylvania Avenue Delmar, DE 19940
2 North Pennsylvania Avenue Delmar, DE 19940
Details & Description
Property Highlights
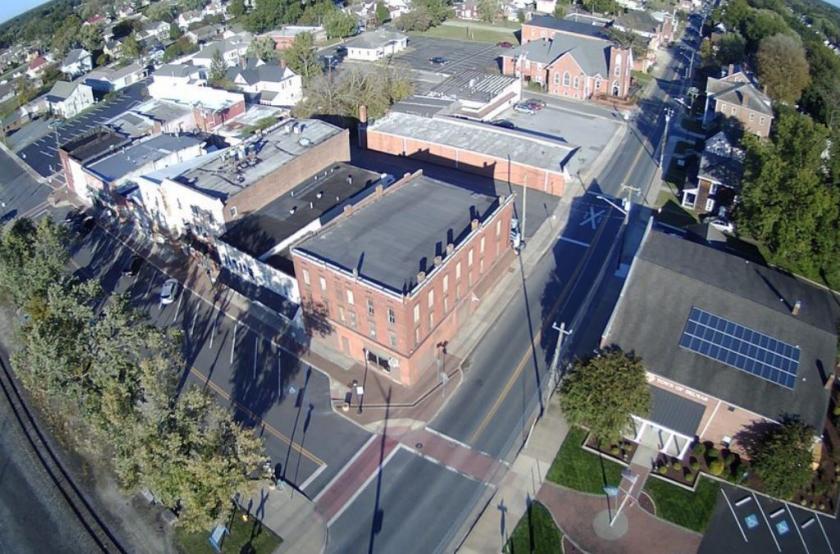
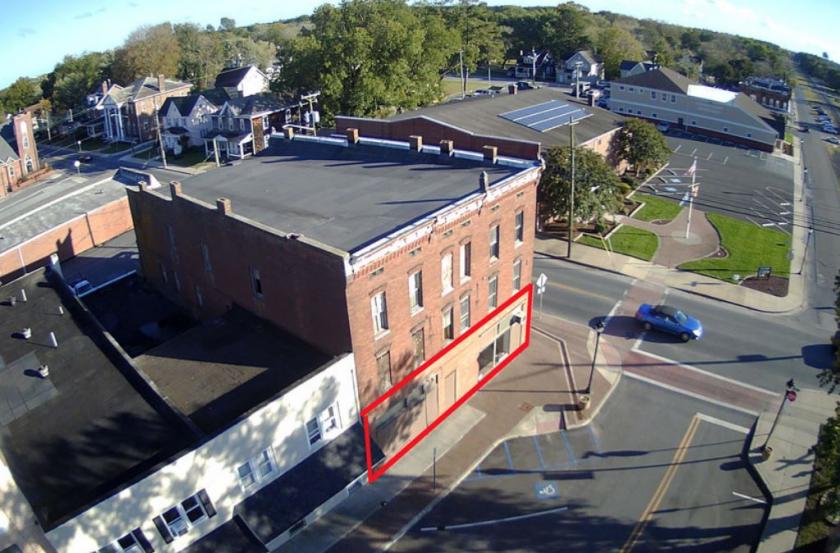
• High Visibility Heavy Traffic Patterns
• Located in Downtown Delmar
Additional Photos
Listing Agents

Chuck Campbell
O: 410-995-8450
M: 443-880-0130
chuck.campbell@kw.com
O: 410-995-8450
M: 443-880-0130
chuck.campbell@kw.com
While we strive to provide the most accurate information, all listing information, and demographic data, is provided by third-parties. As such, MyEListing will not be responsible for the accuracy of the information. It is strongly recommended that you verify all information with the listing agent, and any relevant agencies, prior to making any decisions.


