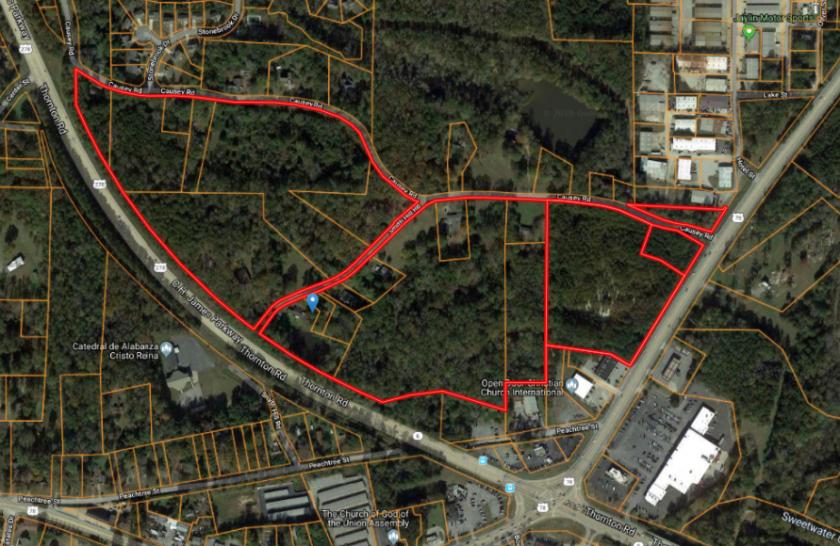
1-Mile | 3-Miles | 5-Miles | ||
---|---|---|---|---|
Total Population | 4,693 | 38,415 | 115,687 | |
Population Median Age | 35 | 35 | 36 | |
Population by Age | 0-9 Yrs | 633 (13%) | 5553 (14%) | 16802 (14%) |
10-19 Yrs | 689 (14%) | 5556 (14%) | 16250 (14%) | |
20-29 Yrs | 760 (16%) | 5422 (14%) | 16074 (13%) | |
30-39 Yrs | 663 (14%) | 5780 (15%) | 16351 (14%) | |
40-49 Yrs | 772 (16%) | 5973 (15%) | 16730 (14%) | |
50-59 Yrs | 579 (12%) | 5184 (13%) | 15663 (13%) | |
60-69 Yrs | 342 (7%) | 2696 (7%) | 9993 (8%) | |
70+ Yrs | 256 (5%) | 2252 (5%) | 7824 (6%) | |
Median HH Income | $46,995 | $54,355 | $57,157 | |
Total Household Income | < 24K | 341 (20%) | 2413 (17%) | 6740 (16%) |
25-49K | 566 (33%) | 3976 (28%) | 11018 (27%) | |
50-74K | 349 (20%) | 3298 (23%) | 8812 (21%) | |
75-99K | 227 (13%) | 1928 (13%) | 5787 (14%) | |
100-199K | 203 (11%) | 2230 (15%) | 7184 (17%) | |
200K+ | 10 (0%) | 159 (1%) | 956 (2%) | |
Highest Education Level | No Diploma | 538 | 3152 | 9652 |
Diploma or GED | 1163 | 7494 | 22520 | |
Some College | 561 | 5237 | 16225 | |
Assoc. Degree | 171 | 2150 | 6006 | |
Bachelors Degree | 371 | 4239 | 13925 | |
Higher Degree | 313 | 2342 | 6513 | |
Total Housing Units | 1,830 | 15,277 | 43,934 | |
--Owner-Occupied | 631 | 7,531 | 23,272 | |
--Renter-Occupied | 1,066 | 6,474 | 17,225 | |
Owner-Occupied Values | < 100K | 242 | 2085 | 5238 |
100-199K | 241 | 4086 | 12483 | |
200-299K | 114 | 1107 | 4061 | |
300-399K | 11 | 206 | 960 | |
400-499K | 10 | 22 | 164 | |
500K+ | 13 | 25 | 366 | |
Total Working Age Population | 3,619 | 29,475 | 88,803 | |
In Work Force | 2,730 | 21,539 | 63,026 | |
Not In Work Force | 889 | 7,937 | 25,777 | |
Workforce Employed | 2,606 | 20,446 | 59,090 | |
Workforce Unemployed | 122 | 1,072 | 3,831 | |
Civlian Workforce | 2,729 | 21,517 | 62,921 | |
Military Workforce | 1 | 21 | 105 | |
Total Households | 1,697 | 14,005 | 40,497 | |
Family Households | 1,099 | 9,324 | 27,941 | |
Non-Family Households | 598 | 4,681 | 12,556 | |
Married Couple | 566 | 5,717 | 17,283 | |
Other Family | 533 | 3,607 | 10,658 | |
Married w/Child | 233 | 2,414 | 7,540 | |
Single Male w/Child | 17 | 271 | 928 | |
Single Female w/Child | 250 | 1,693 | 4,631 |
Population Change Last Two Decades - Plus Projection
2000 | % | 2010 | % | 2020 | % | 2030 | |
---|---|---|---|---|---|---|---|
Georgia | 8,186,453 | +18 | 9,687,653 | +12 | 10,833,472 | +13 | 12,292,423 |
Cobb County | 607,751 | +13 | 688,078 | +15 | 790,588 | +19 | 938,747 |
Douglas County | 92,174 | +44 | 132,403 | +15 | 151,906 | +20 | 182,157 |
Fulton County | 816,006 | +13 | 920,581 | +19 | 1,099,181 | +18 | 1,300,861 |
Paulding County | 81,678 | +74 | 142,324 | +21 | 172,542 | +21 | 208,525 |
Total Working Age Population:
Total Households:
Total Working Age Population:
Total Households:
Total Working Age Population:
Total Households: