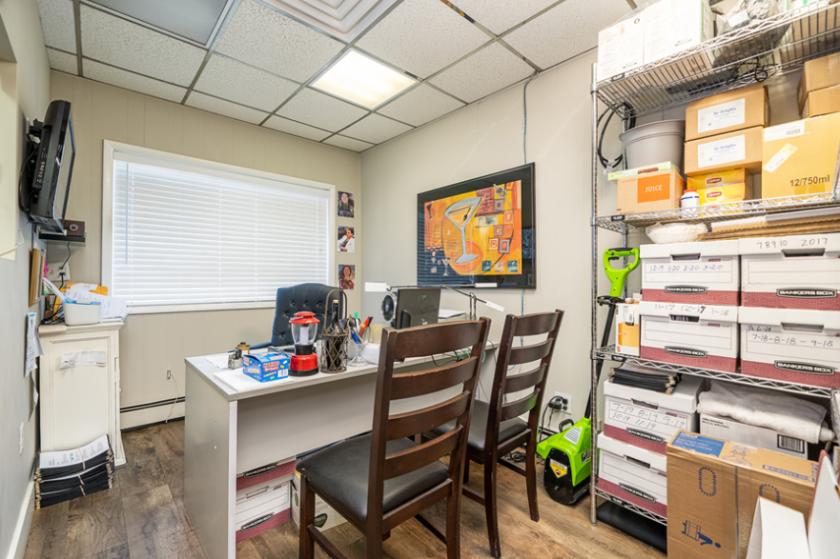
Office Space
58 County Avenue Secaucus, NJ 07094
58 County Avenue Secaucus, NJ 07094
Details & Description
Property Highlights
- • x5 Unit Mixed-use Investment Property
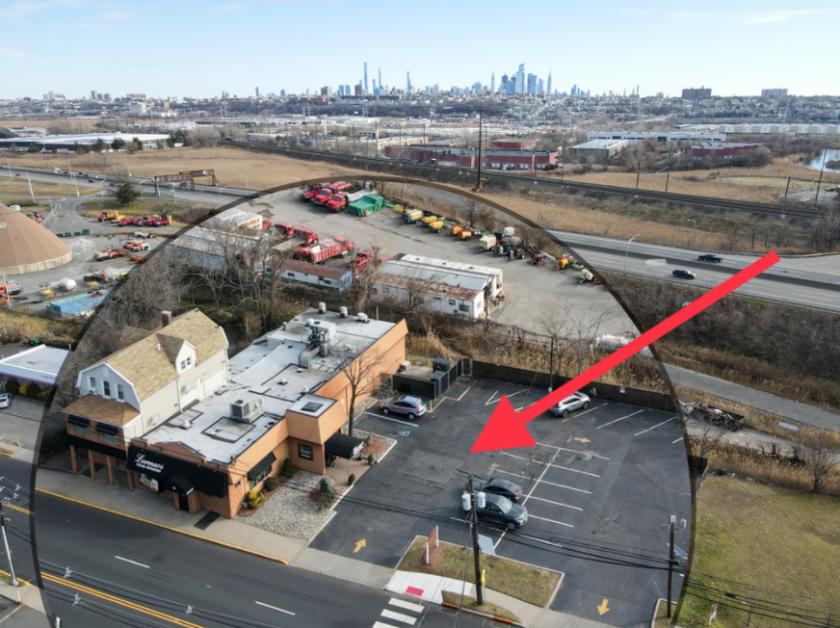
- • Spacious .41 acre or 17,860 Sq Ft Lot
- • Thriving Location in Heavy Development Area
- • Sits relatively flat with tons of parking
Listing Agents

Bruce Elia Jr.
KW Commercial
O: 201-917-5884
M: 201-315-1223
brucejr@kw.com
KW Commercial
O: 201-917-5884
M: 201-315-1223
brucejr@kw.com
While we strive to provide the most accurate information, all listing information, and demographic data, is provided by third-parties. As such, MyEListing will not be responsible for the accuracy of the information. It is strongly recommended that you verify all information with the listing agent, and any relevant agencies, prior to making any decisions.