Commercial Land
19222 Midland Drive Shawnee, KS 66218
19222 Midland Drive Shawnee, KS 66218
Details & Description
Property Highlights
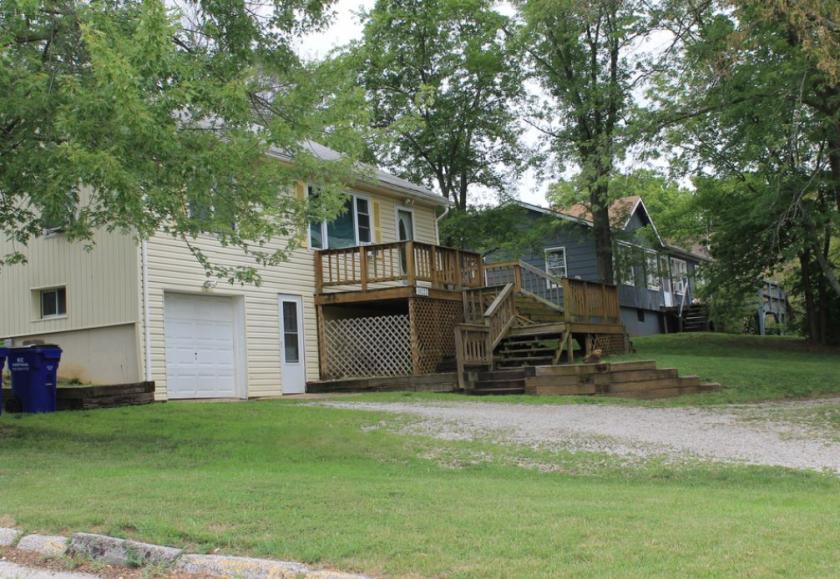
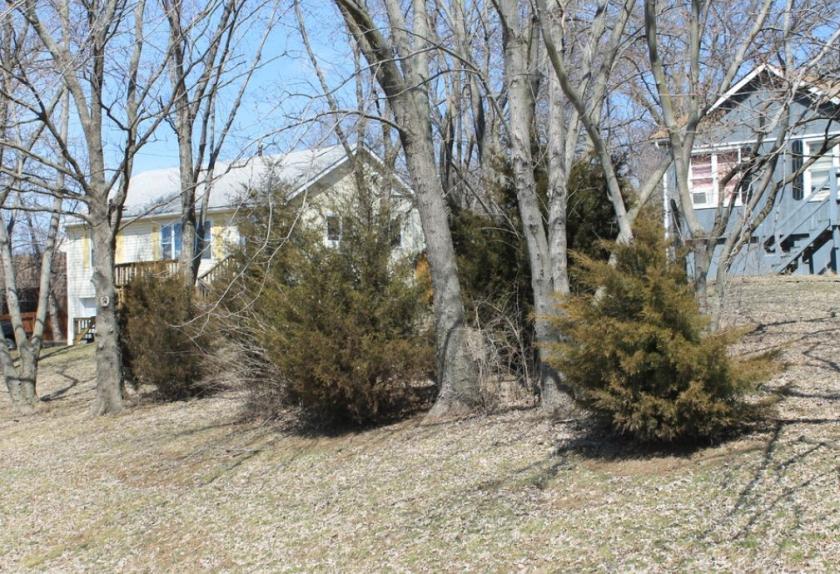
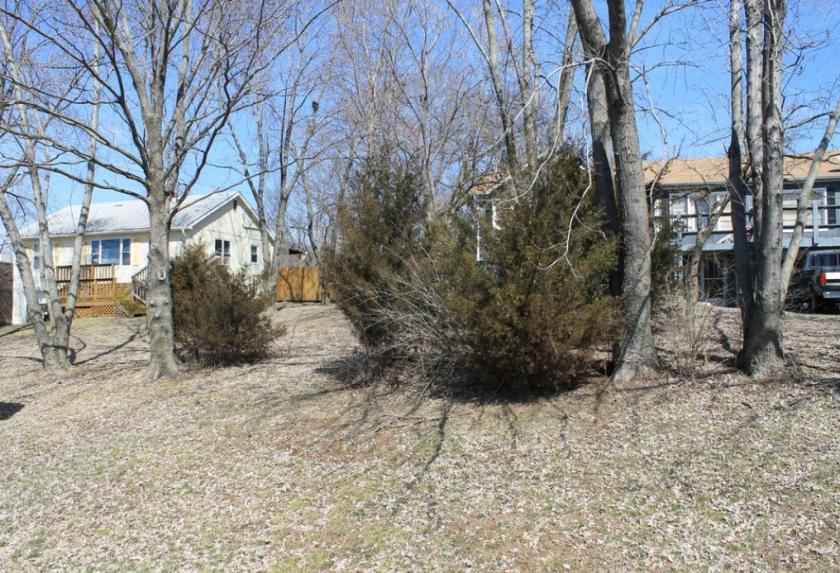
• Lot contains two homes
• Commercially zoned
Additional Photos

Listing Agents

Paul Byers
KW Commercial
O: 913-909-9700
paulbyers@kwcommercial.com
KW Commercial
O: 913-909-9700
paulbyers@kwcommercial.com
While we strive to provide the most accurate information, all listing information, and demographic data, is provided by third-parties. As such, MyEListing will not be responsible for the accuracy of the information. It is strongly recommended that you verify all information with the listing agent, and any relevant agencies, prior to making any decisions.


