Retail Space
586 Cobb Parkway South Marietta, GA 30060
586 Cobb Parkway South Marietta, GA 30060

Details & Description
Property Highlights
- • Fully leased 3 years
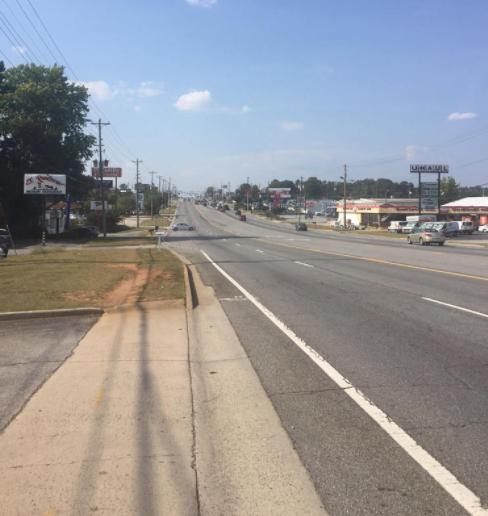
- • Monument sign
- • 37,621 Traffic Count
- • Great market and sub market
Listing Agents

Jonathan Doone
KW Commercial
O: 213-908-3914
jonathan.doone@kw.com
KW Commercial
O: 213-908-3914
jonathan.doone@kw.com
While we strive to provide the most accurate information, all listing information, and demographic data, is provided by third-parties. As such, MyEListing will not be responsible for the accuracy of the information. It is strongly recommended that you verify all information with the listing agent, and any relevant agencies, prior to making any decisions.