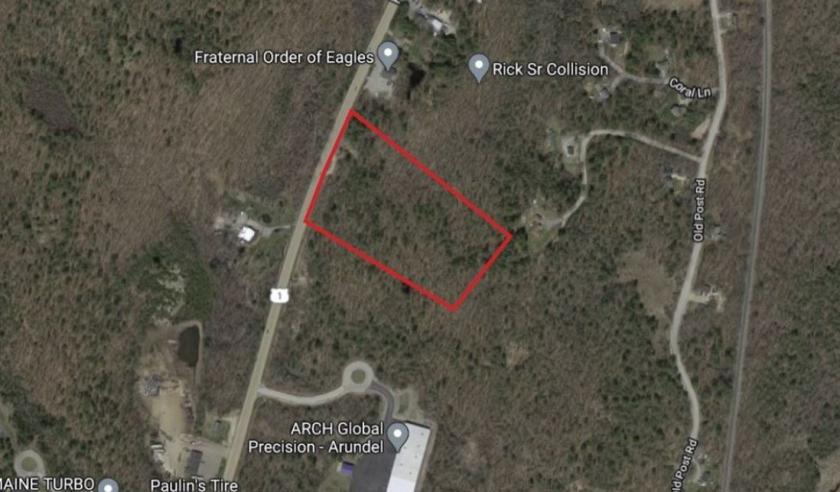
1-Mile | 3-Miles | 5-Miles | ||
---|---|---|---|---|
Total Population | 549 | 7,088 | 38,370 | |
Population Median Age | 45 | 44 | 41 | |
Population by Age | 0-9 Yrs | 53 (9%) | 578 (8%) | 3746 (9%) |
10-19 Yrs | 59 (10%) | 945 (13%) | 4043 (10%) | |
20-29 Yrs | 39 (7%) | 608 (8%) | 6370 (16%) | |
30-39 Yrs | 62 (11%) | 760 (10%) | 4141 (10%) | |
40-49 Yrs | 70 (12%) | 973 (13%) | 4958 (12%) | |
50-59 Yrs | 89 (16%) | 965 (13%) | 4978 (12%) | |
60-69 Yrs | 111 (20%) | 1255 (17%) | 5265 (13%) | |
70+ Yrs | 67 (12%) | 1003 (14%) | 4870 (12%) | |
Median HH Income | $72,157 | $70,042 | $59,074 | |
Total Household Income | < 24K | 24 (10%) | 384 (13%) | 2679 (16%) |
25-49K | 45 (20%) | 631 (21%) | 4188 (25%) | |
50-74K | 49 (21%) | 548 (18%) | 3535 (21%) | |
75-99K | 47 (20%) | 555 (19%) | 2217 (13%) | |
100-199K | 48 (21%) | 647 (22%) | 3305 (19%) | |
200K+ | 11 (4%) | 131 (4%) | 638 (3%) | |
Highest Education Level | No Diploma | 23 | 423 | 2448 |
Diploma or GED | 126 | 1678 | 8848 | |
Some College | 75 | 913 | 4801 | |
Assoc. Degree | 27 | 502 | 2522 | |
Bachelors Degree | 115 | 1147 | 5784 | |
Higher Degree | 52 | 633 | 3305 | |
Total Housing Units | 257 | 3,281 | 18,310 | |
--Owner-Occupied | 192 | 2,360 | 9,043 | |
--Renter-Occupied | 32 | 537 | 7,520 | |
Owner-Occupied Values | < 100K | 25 | 220 | 505 |
100-199K | 32 | 413 | 2183 | |
200-299K | 70 | 978 | 3349 | |
300-399K | 37 | 452 | 1850 | |
400-499K | 12 | 131 | 526 | |
500K+ | 16 | 167 | 630 | |
Total Working Age Population | 458 | 5,873 | 32,080 | |
In Work Force | 277 | 3,703 | 21,610 | |
Not In Work Force | 180 | 2,170 | 10,470 | |
Workforce Employed | 272 | 3,606 | 20,715 | |
Workforce Unemployed | 5 | 97 | 829 | |
Civlian Workforce | 277 | 3,703 | 21,544 | |
Military Workforce | 0 | 0 | 65 | |
Total Households | 224 | 2,896 | 16,563 | |
Family Households | 162 | 1,946 | 10,126 | |
Non-Family Households | 62 | 950 | 6,437 | |
Married Couple | 135 | 1,593 | 7,087 | |
Other Family | 27 | 353 | 3,039 | |
Married w/Child | 36 | 513 | 2,377 | |
Single Male w/Child | 4 | 36 | 350 | |
Single Female w/Child | 11 | 121 | 1,150 |
Population Change Last Two Decades - Plus Projection
2000 | % | 2010 | % | 2020 | % | 2030 | |
---|---|---|---|---|---|---|---|
Maine | 1,274,923 | +4 | 1,328,361 | +1 | 1,335,260 | 0 | 1,341,046 |
Cumberland County | 265,612 | +6 | 281,674 | +5 | 294,711 | +2 | 301,376 |
York County | 186,742 | +6 | 197,131 | +6 | 208,062 | +5 | 217,689 |
Total Working Age Population:
Total Households:
Total Working Age Population:
Total Households:
Total Working Age Population:
Total Households: