Multifamily Housing
1425 Harrelton Drive Evansville, IN 47714
1425 Harrelton Drive Evansville, IN 47714

Details & Description
Property Highlights
- • Great Investment
- • 8 Unit Apartment
- • Recent Renovations
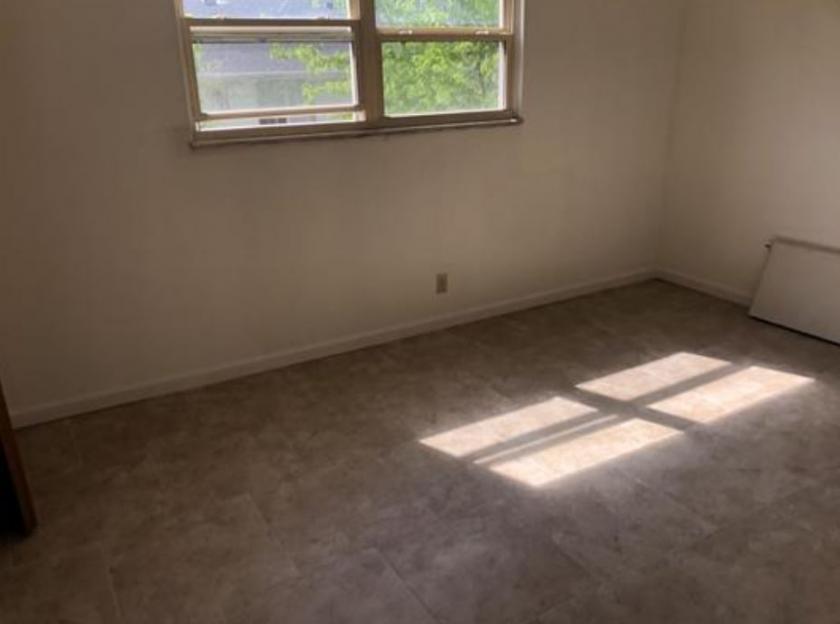
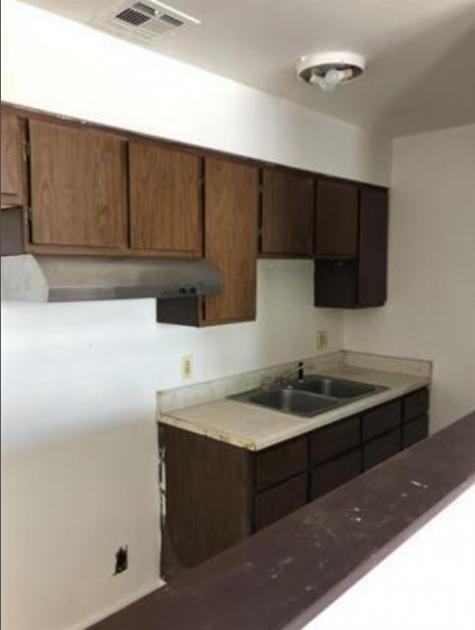
Additional Photos

Listing Agents

Charlie Butler
O: 812-449-0050
cbutler@kwcommercial.com
O: 812-449-0050
cbutler@kwcommercial.com
While we strive to provide the most accurate information, all listing information, and demographic data, is provided by third-parties. As such, MyEListing will not be responsible for the accuracy of the information. It is strongly recommended that you verify all information with the listing agent, and any relevant agencies, prior to making any decisions.


