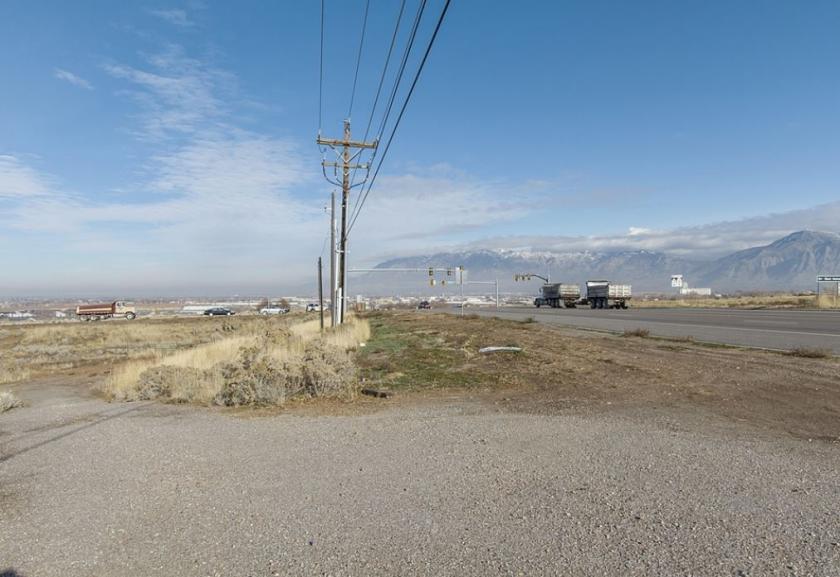
Commercial Land
3673 South 1900 West Roy, UT 84067
3673 South 1900 West Roy, UT 84067

Details & Description
Property Highlights
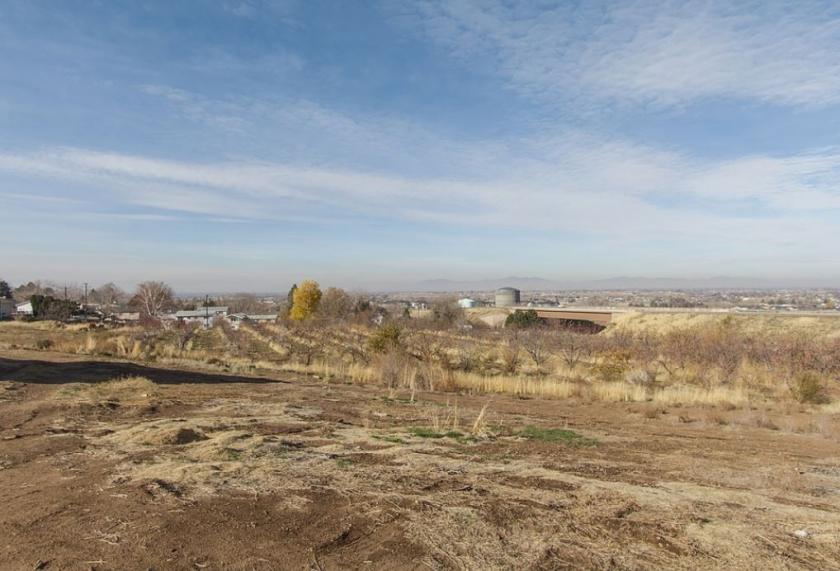
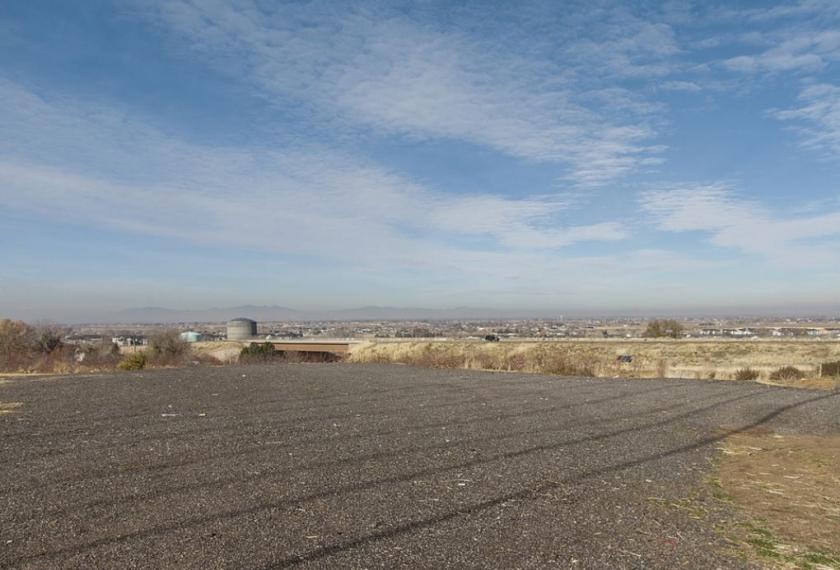
• Significant Residential growth planned and currently under construction
• 20,000 AADT along 1900 West and growing
Additional Photos
Listing Agents

Boyd Brown
KW Boyd Brown Team
O: 801-326-8886
M: 801-598-5838
boyd@kw.com
KW Boyd Brown Team
O: 801-326-8886
M: 801-598-5838
boyd@kw.com
While we strive to provide the most accurate information, all listing information, and demographic data, is provided by third-parties. As such, MyEListing will not be responsible for the accuracy of the information. It is strongly recommended that you verify all information with the listing agent, and any relevant agencies, prior to making any decisions.


