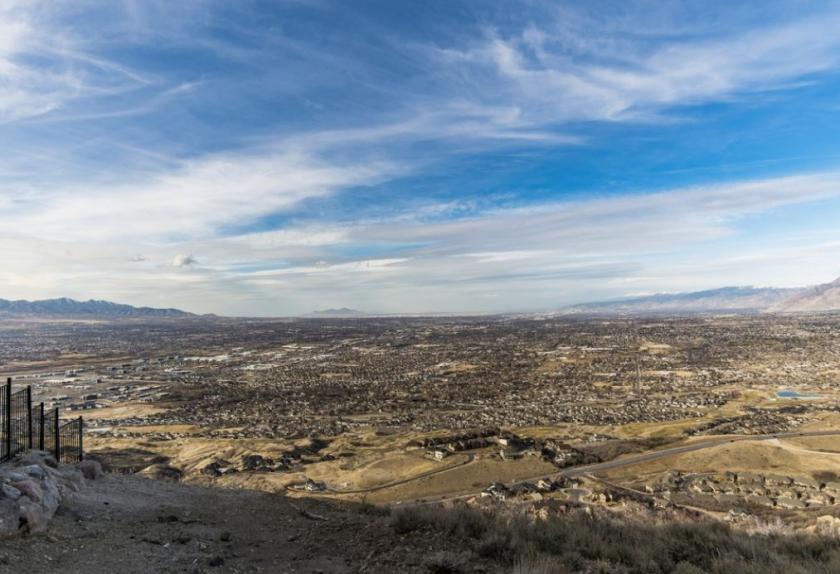
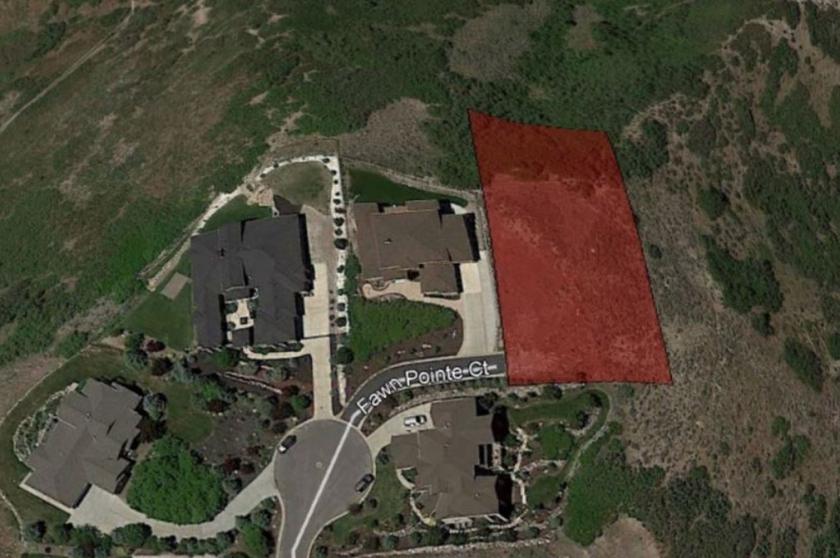
1-Mile | 3-Miles | 5-Miles | ||
---|---|---|---|---|
Total Population | 4,477 | 37,071 | 123,672 | |
Population Median Age | 32 | 32 | 31 | |
Population by Age | 0-9 Yrs | 782 (17%) | 6577 (17%) | 23672 (19%) |
10-19 Yrs | 894 (19%) | 7285 (19%) | 23853 (19%) | |
20-29 Yrs | 455 (10%) | 3758 (10%) | 14292 (11%) | |
30-39 Yrs | 563 (12%) | 5326 (14%) | 17274 (13%) | |
40-49 Yrs | 778 (17%) | 6200 (16%) | 17598 (14%) | |
50-59 Yrs | 504 (11%) | 4057 (10%) | 12798 (10%) | |
60-69 Yrs | 326 (7%) | 2211 (5%) | 8560 (6%) | |
70+ Yrs | 176 (3%) | 1656 (4%) | 5624 (4%) | |
Median HH Income | $131,758 | $125,378 | $113,573 | |
Total Household Income | < 24K | 102 (7%) | 606 (6%) | 1851 (5%) |
25-49K | 96 (7%) | 848 (8%) | 3417 (10%) | |
50-74K | 138 (10%) | 1316 (13%) | 4473 (13%) | |
75-99K | 122 (9%) | 1009 (10%) | 4706 (13%) | |
100-199K | 481 (37%) | 3759 (37%) | 13336 (39%) | |
200K+ | 350 (27%) | 2462 (24%) | 6032 (17%) | |
Highest Education Level | No Diploma | 24 | 833 | 2354 |
Diploma or GED | 243 | 2773 | 9278 | |
Some College | 562 | 5035 | 17053 | |
Assoc. Degree | 218 | 1624 | 6317 | |
Bachelors Degree | 927 | 6885 | 21900 | |
Higher Degree | 625 | 4384 | 12780 | |
Total Housing Units | 1,346 | 10,470 | 35,253 | |
--Owner-Occupied | 1,097 | 8,205 | 27,433 | |
--Renter-Occupied | 191 | 1,796 | 6,383 | |
Owner-Occupied Values | < 100K | 7 | 62 | 422 |
100-199K | 21 | 186 | 815 | |
200-299K | 119 | 885 | 4323 | |
300-399K | 182 | 1288 | 6127 | |
400-499K | 274 | 1654 | 5423 | |
500K+ | 495 | 4129 | 10324 | |
Total Working Age Population | 3,113 | 25,547 | 84,578 | |
In Work Force | 2,231 | 16,980 | 58,113 | |
Not In Work Force | 881 | 8,567 | 26,465 | |
Workforce Employed | 2,176 | 16,548 | 56,240 | |
Workforce Unemployed | 56 | 413 | 1,769 | |
Civlian Workforce | 2,231 | 16,962 | 58,009 | |
Military Workforce | 0 | 18 | 104 | |
Total Households | 1,288 | 10,001 | 33,816 | |
Family Households | 1,143 | 8,709 | 29,455 | |
Non-Family Households | 146 | 1,293 | 4,361 | |
Married Couple | 988 | 7,616 | 25,778 | |
Other Family | 155 | 1,093 | 3,677 | |
Married w/Child | 559 | 4,457 | 14,753 | |
Single Male w/Child | 25 | 245 | 630 | |
Single Female w/Child | 71 | 423 | 1,430 |
Population Change Last Two Decades - Plus Projection
2000 | % | 2010 | % | 2020 | % | 2030 | |
---|---|---|---|---|---|---|---|
Utah | 2,233,169 | +24 | 2,763,885 | +20 | 3,325,425 | +17 | 3,889,310 |
Salt Lake County | 898,387 | +15 | 1,029,655 | +15 | 1,181,471 | +11 | 1,306,414 |
Utah County | 368,536 | +40 | 516,564 | +31 | 679,188 | +27 | 861,852 |
Total Working Age Population:
Total Households:
Total Working Age Population:
Total Households:
Total Working Age Population:
Total Households: