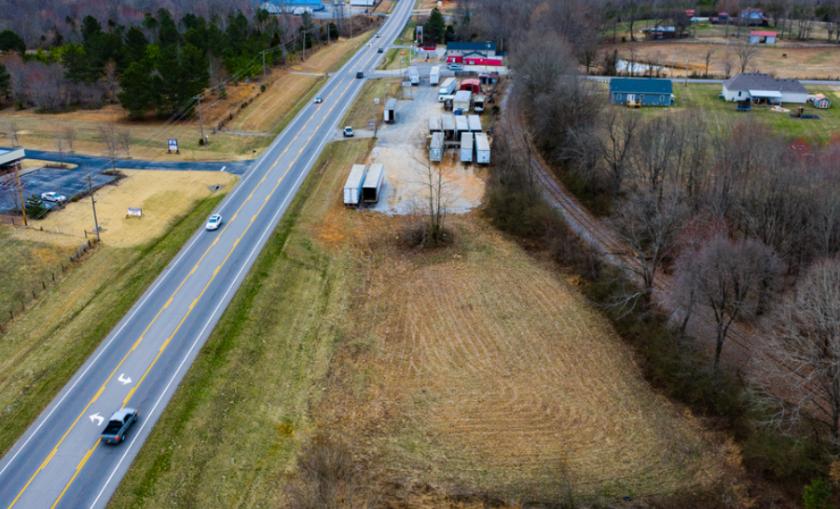
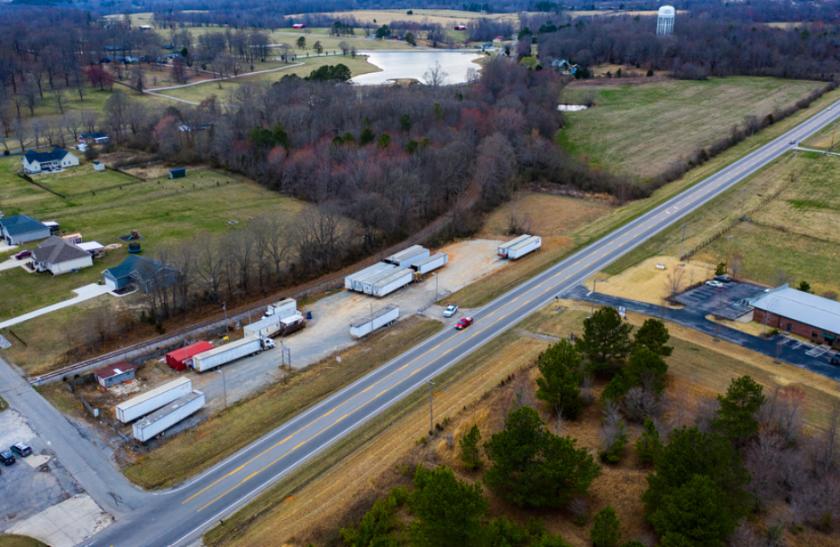
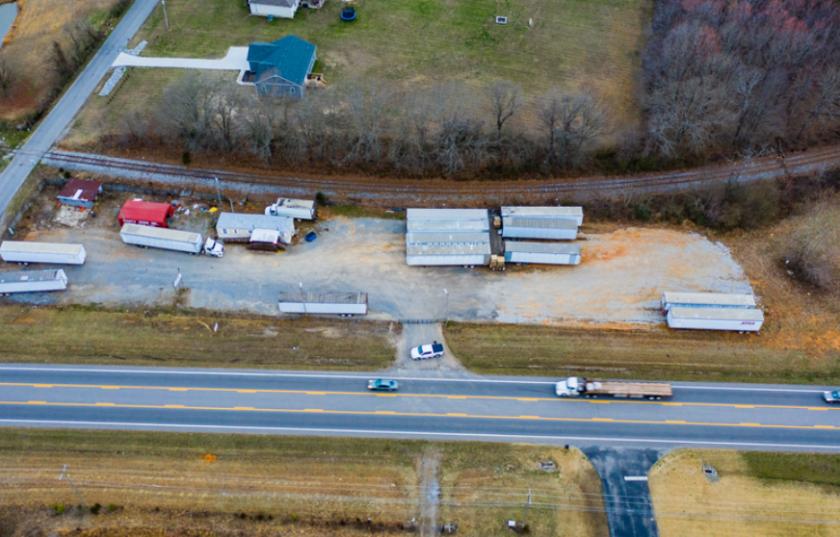
1-Mile | 3-Miles | 5-Miles | ||
---|---|---|---|---|
Total Population | 375 | 3,873 | 12,302 | |
Population Median Age | 38 | 38 | 38 | |
Population by Age | 0-9 Yrs | 45 (12%) | 458 (11%) | 1421 (11%) |
10-19 Yrs | 50 (13%) | 612 (15%) | 1967 (15%) | |
20-29 Yrs | 47 (12%) | 452 (11%) | 1442 (11%) | |
30-39 Yrs | 53 (14%) | 538 (13%) | 1702 (13%) | |
40-49 Yrs | 55 (14%) | 571 (14%) | 1720 (13%) | |
50-59 Yrs | 47 (12%) | 515 (13%) | 1679 (13%) | |
60-69 Yrs | 44 (11%) | 408 (10%) | 1280 (10%) | |
70+ Yrs | 34 (9%) | 319 (8%) | 1092 (8%) | |
Median HH Income | $57,746 | $57,425 | $56,552 | |
Total Household Income | < 24K | 16 (11%) | 186 (13%) | 650 (15%) |
25-49K | 36 (26%) | 375 (27%) | 1200 (27%) | |
50-74K | 34 (24%) | 287 (21%) | 866 (20%) | |
75-99K | 23 (16%) | 245 (17%) | 683 (15%) | |
100-199K | 27 (19%) | 261 (19%) | 780 (18%) | |
200K+ | 1 (0%) | 13 (0%) | 149 (3%) | |
Highest Education Level | No Diploma | 23 | 293 | 1075 |
Diploma or GED | 106 | 1201 | 3642 | |
Some College | 61 | 539 | 1783 | |
Assoc. Degree | 25 | 217 | 598 | |
Bachelors Degree | 37 | 306 | 886 | |
Higher Degree | 8 | 79 | 341 | |
Total Housing Units | 146 | 1,536 | 4,907 | |
--Owner-Occupied | 119 | 1,182 | 3,577 | |
--Renter-Occupied | 18 | 184 | 751 | |
Owner-Occupied Values | < 100K | 14 | 203 | 634 |
100-199K | 52 | 577 | 1760 | |
200-299K | 37 | 283 | 701 | |
300-399K | 10 | 74 | 319 | |
400-499K | 4 | 28 | 77 | |
500K+ | 2 | 17 | 85 | |
Total Working Age Population | 296 | 2,998 | 9,547 | |
In Work Force | 200 | 1,968 | 6,056 | |
Not In Work Force | 96 | 1,030 | 3,490 | |
Workforce Employed | 198 | 1,914 | 5,863 | |
Workforce Unemployed | 2 | 54 | 194 | |
Civlian Workforce | 200 | 1,968 | 6,056 | |
Military Workforce | 0 | 0 | 0 | |
Total Households | 137 | 1,366 | 4,328 | |
Family Households | 93 | 944 | 3,066 | |
Non-Family Households | 45 | 422 | 1,262 | |
Married Couple | 82 | 765 | 2,430 | |
Other Family | 11 | 179 | 635 | |
Married w/Child | 35 | 313 | 984 | |
Single Male w/Child | 2 | 17 | 67 | |
Single Female w/Child | 4 | 71 | 250 |
Population Change Last Two Decades - Plus Projection
2000 | % | 2010 | % | 2020 | % | 2030 | |
---|---|---|---|---|---|---|---|
Tennessee | 5,689,283 | +12 | 6,346,105 | +9 | 6,886,369 | +7 | 7,393,069 |
Cheatham County | 35,912 | +9 | 39,105 | +4 | 40,847 | +3 | 42,172 |
Dickson County | 43,156 | +15 | 49,666 | +10 | 54,606 | +9 | 59,554 |
Hickman County | 22,295 | +11 | 24,690 | +3 | 25,352 | +4 | 26,401 |
Total Working Age Population:
Total Households:
Total Working Age Population:
Total Households:
Total Working Age Population:
Total Households: