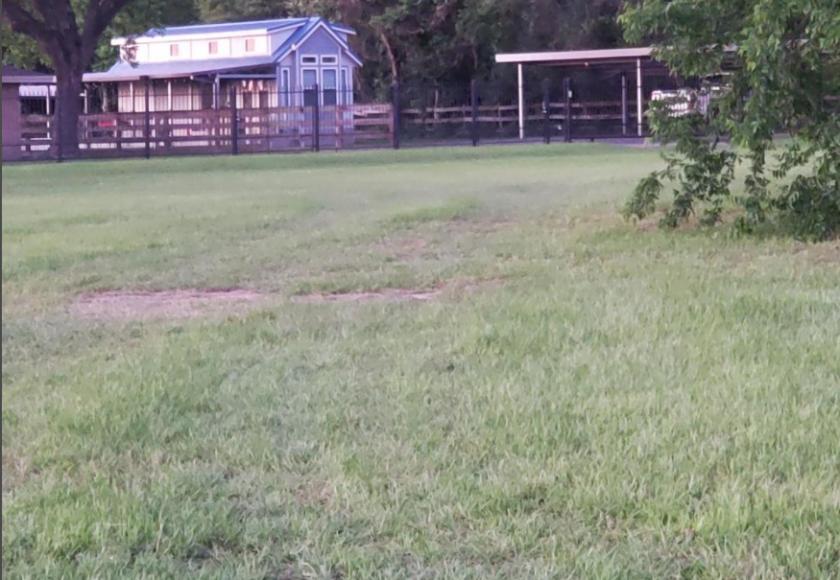
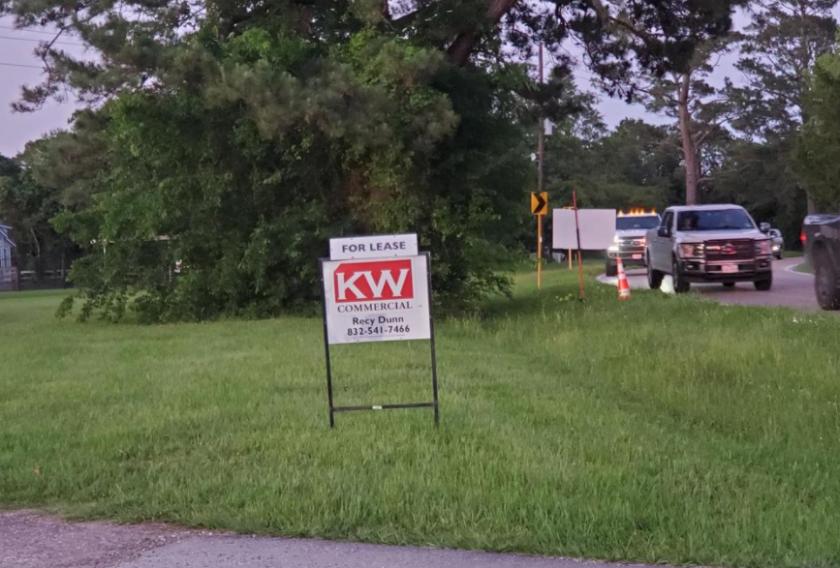
1-Mile | 3-Miles | 5-Miles | ||
---|---|---|---|---|
Total Population | 3,993 | 30,576 | 112,395 | |
Population Median Age | 33 | 35 | 35 | |
Population by Age | 0-9 Yrs | 773 (19%) | 4892 (15%) | 17706 (15%) |
10-19 Yrs | 539 (13%) | 4284 (14%) | 17711 (15%) | |
20-29 Yrs | 536 (13%) | 4061 (13%) | 12951 (11%) | |
30-39 Yrs | 575 (14%) | 3845 (12%) | 14066 (12%) | |
40-49 Yrs | 684 (17%) | 4892 (15%) | 18010 (16%) | |
50-59 Yrs | 381 (9%) | 3727 (12%) | 14291 (12%) | |
60-69 Yrs | 292 (7%) | 2646 (8%) | 9316 (8%) | |
70+ Yrs | 211 (5%) | 2229 (7%) | 8343 (7%) | |
Median HH Income | $101,567 | $100,004 | $104,812 | |
Total Household Income | < 24K | 77 (5%) | 684 (6%) | 3180 (8%) |
25-49K | 237 (17%) | 1756 (17%) | 4664 (12%) | |
50-74K | 214 (15%) | 1468 (14%) | 5017 (13%) | |
75-99K | 146 (10%) | 1212 (11%) | 4595 (12%) | |
100-199K | 398 (28%) | 2951 (28%) | 11074 (30%) | |
200K+ | 300 (21%) | 2170 (21%) | 7906 (21%) | |
Highest Education Level | No Diploma | 95 | 1035 | 4012 |
Diploma or GED | 393 | 3747 | 13388 | |
Some College | 502 | 4433 | 13965 | |
Assoc. Degree | 232 | 1643 | 5749 | |
Bachelors Degree | 736 | 5577 | 22144 | |
Higher Degree | 461 | 2981 | 11696 | |
Total Housing Units | 1,420 | 10,768 | 38,365 | |
--Owner-Occupied | 938 | 7,693 | 27,396 | |
--Renter-Occupied | 434 | 2,548 | 9,041 | |
Owner-Occupied Values | < 100K | 31 | 424 | 1823 |
100-199K | 180 | 1876 | 6522 | |
200-299K | 281 | 1747 | 5812 | |
300-399K | 102 | 978 | 4908 | |
400-499K | 90 | 716 | 2090 | |
500K+ | 254 | 1952 | 6241 | |
Total Working Age Population | 2,832 | 22,709 | 82,789 | |
In Work Force | 2,046 | 15,646 | 55,296 | |
Not In Work Force | 786 | 7,063 | 27,493 | |
Workforce Employed | 1,959 | 14,836 | 52,818 | |
Workforce Unemployed | 84 | 775 | 2,431 | |
Civlian Workforce | 2,043 | 15,611 | 55,249 | |
Military Workforce | 3 | 35 | 47 | |
Total Households | 1,373 | 10,241 | 36,438 | |
Family Households | 1,063 | 7,933 | 29,009 | |
Non-Family Households | 309 | 2,308 | 7,429 | |
Married Couple | 875 | 6,663 | 24,442 | |
Other Family | 188 | 1,271 | 4,567 | |
Married w/Child | 505 | 3,343 | 13,335 | |
Single Male w/Child | 69 | 358 | 721 | |
Single Female w/Child | 55 | 426 | 1,666 |
Population Change Last Two Decades - Plus Projection
2000 | % | 2010 | % | 2020 | % | 2030 | |
---|---|---|---|---|---|---|---|
Texas | 20,851,820 | +21 | 25,145,561 | +18 | 29,677,668 | +18 | 34,894,452 |
Harris County | 3,400,578 | +20 | 4,092,459 | +22 | 4,978,845 | +19 | 5,924,750 |
Montgomery County | 293,768 | +55 | 455,746 | +35 | 613,951 | +35 | 831,450 |
Total Working Age Population:
Total Households:
Total Working Age Population:
Total Households:
Total Working Age Population:
Total Households: