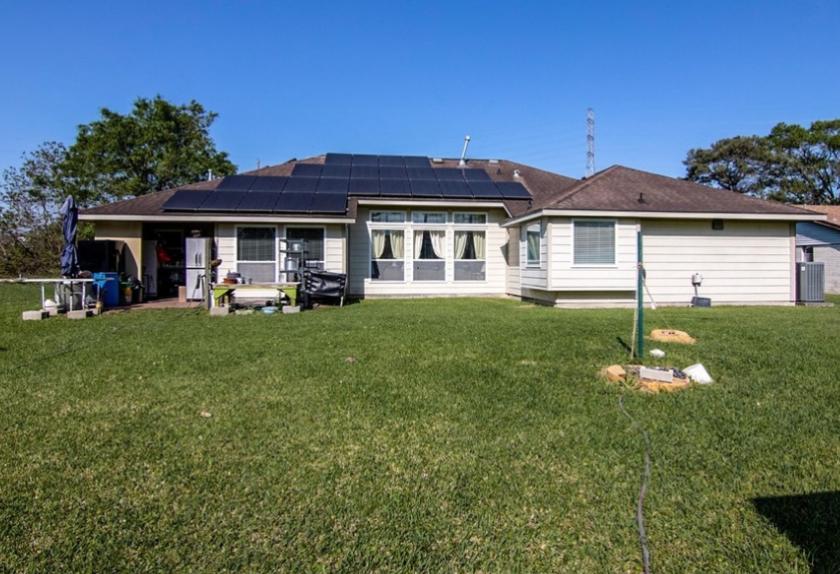
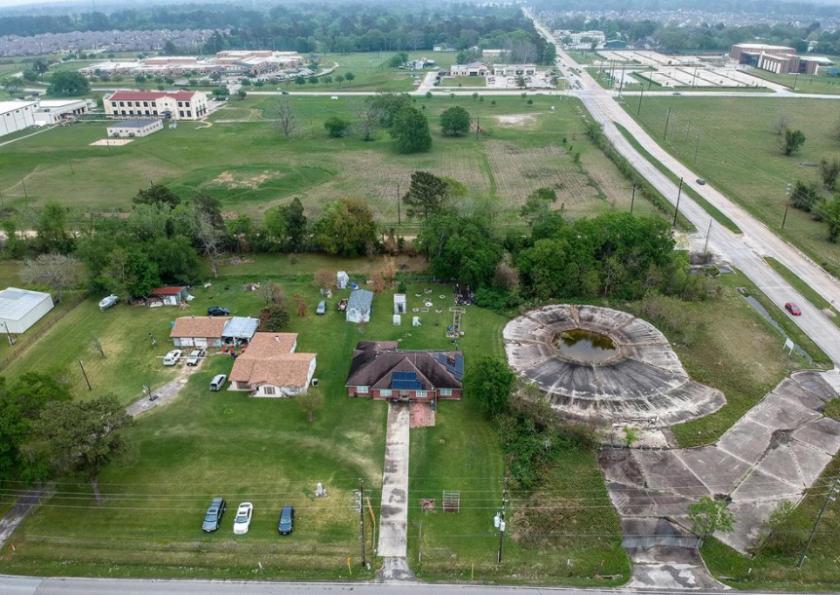
1-Mile | 3-Miles | 5-Miles | ||
---|---|---|---|---|
Total Population | 8,077 | 65,610 | 202,549 | |
Population Median Age | 32 | 35 | 36 | |
Population by Age | 0-9 Yrs | 1533 (18%) | 9808 (14%) | 29180 (14%) |
10-19 Yrs | 1485 (18%) | 10440 (15%) | 28597 (14%) | |
20-29 Yrs | 816 (10%) | 7875 (12%) | 25711 (12%) | |
30-39 Yrs | 1337 (16%) | 9670 (14%) | 30738 (15%) | |
40-49 Yrs | 1324 (16%) | 10370 (15%) | 29607 (14%) | |
50-59 Yrs | 622 (7%) | 7260 (11%) | 24467 (12%) | |
60-69 Yrs | 592 (7%) | 6026 (9%) | 19728 (9%) | |
70+ Yrs | 368 (4%) | 4160 (6%) | 14522 (7%) | |
Median HH Income | $95,573 | $93,651 | $89,959 | |
Total Household Income | < 24K | 173 (7%) | 1595 (7%) | 6944 (9%) |
25-49K | 319 (13%) | 3068 (14%) | 11272 (15%) | |
50-74K | 427 (18%) | 3593 (16%) | 11120 (15%) | |
75-99K | 316 (13%) | 3338 (15%) | 9859 (13%) | |
100-199K | 886 (37%) | 7352 (34%) | 21793 (30%) | |
200K+ | 238 (10%) | 2548 (11%) | 9484 (13%) | |
Highest Education Level | No Diploma | 388 | 3106 | 9653 |
Diploma or GED | 1127 | 8002 | 24684 | |
Some College | 1016 | 9676 | 31305 | |
Assoc. Degree | 359 | 3879 | 11263 | |
Bachelors Degree | 1070 | 11456 | 36974 | |
Higher Degree | 627 | 5441 | 18528 | |
Total Housing Units | 2,565 | 22,722 | 75,802 | |
--Owner-Occupied | 1,754 | 15,622 | 47,756 | |
--Renter-Occupied | 605 | 5,873 | 22,716 | |
Owner-Occupied Values | < 100K | 146 | 847 | 2433 |
100-199K | 748 | 6095 | 16946 | |
200-299K | 569 | 5007 | 14407 | |
300-399K | 210 | 2269 | 7375 | |
400-499K | 66 | 605 | 2594 | |
500K+ | 17 | 798 | 4001 | |
Total Working Age Population | 5,544 | 49,137 | 154,988 | |
In Work Force | 4,068 | 34,952 | 108,513 | |
Not In Work Force | 1,476 | 14,185 | 46,475 | |
Workforce Employed | 3,841 | 33,414 | 103,586 | |
Workforce Unemployed | 220 | 1,515 | 4,784 | |
Civlian Workforce | 4,061 | 34,929 | 108,370 | |
Military Workforce | 6 | 22 | 143 | |
Total Households | 2,359 | 21,495 | 70,471 | |
Family Households | 1,940 | 16,518 | 52,061 | |
Non-Family Households | 420 | 4,977 | 18,410 | |
Married Couple | 1,483 | 13,107 | 41,422 | |
Other Family | 457 | 3,410 | 10,639 | |
Married w/Child | 895 | 6,951 | 19,432 | |
Single Male w/Child | 82 | 399 | 1,545 | |
Single Female w/Child | 125 | 1,415 | 4,371 |
Population Change Last Two Decades - Plus Projection
2000 | % | 2010 | % | 2020 | % | 2030 | |
---|---|---|---|---|---|---|---|
Texas | 20,851,820 | +21 | 25,145,561 | +18 | 29,677,668 | +18 | 34,894,452 |
Harris County | 3,400,578 | +20 | 4,092,459 | +22 | 4,978,845 | +19 | 5,924,750 |
Montgomery County | 293,768 | +55 | 455,746 | +35 | 613,951 | +35 | 831,450 |
Total Working Age Population:
Total Households:
Total Working Age Population:
Total Households:
Total Working Age Population:
Total Households: