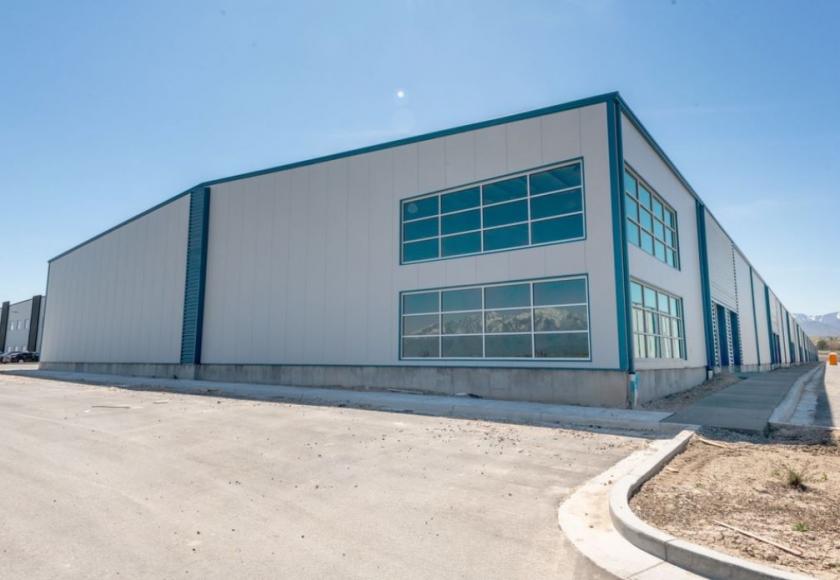
Industrial Properties
6550 Airport Road West Jordan, UT 84084
6550 Airport Road West Jordan, UT 84084
Details & Description
Property Highlights
- • Up To 115,000 sq. ft. available
- • 1-19 Units Divisible to 6,250 sq. ft.
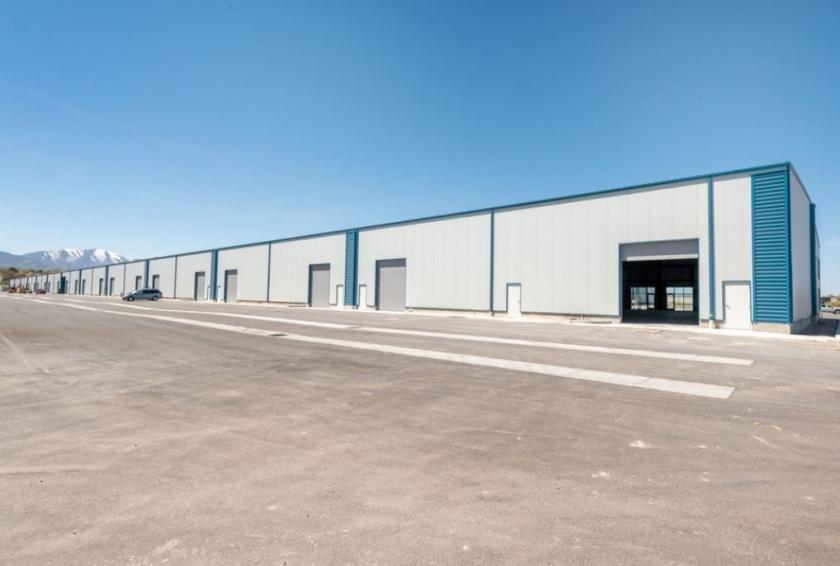
- • 1 High dock door per unit
- • Generous Allowances for buildout
- • Power 3 phase 480 volt 200 amp
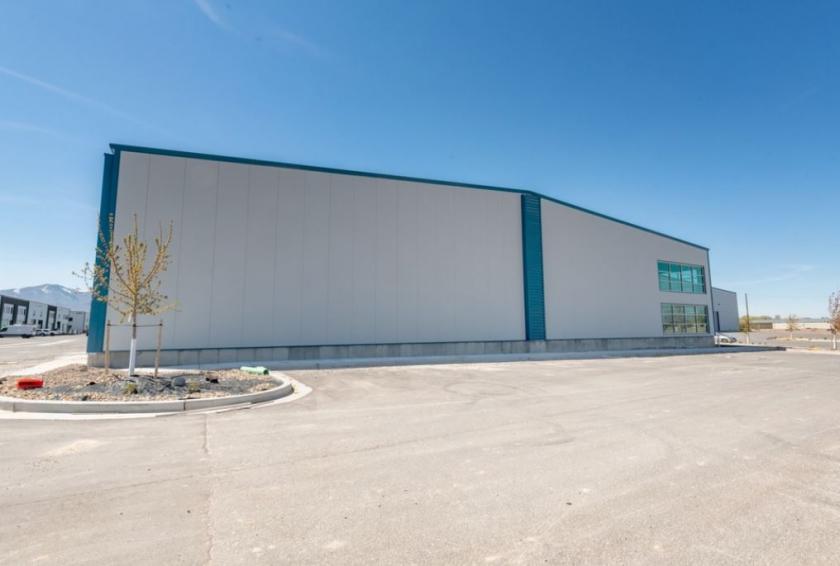
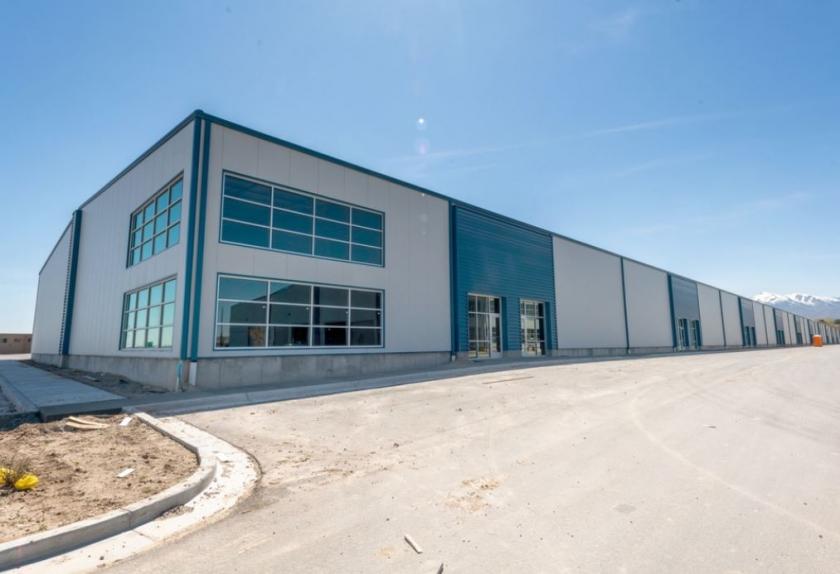
Additional Photos
Listing Agents

Boyd Brown
KW Boyd Brown Team
O: 801-326-8886
M: 801-598-5838
boyd@kw.com
KW Boyd Brown Team
O: 801-326-8886
M: 801-598-5838
boyd@kw.com
While we strive to provide the most accurate information, all listing information, and demographic data, is provided by third-parties. As such, MyEListing will not be responsible for the accuracy of the information. It is strongly recommended that you verify all information with the listing agent, and any relevant agencies, prior to making any decisions.


