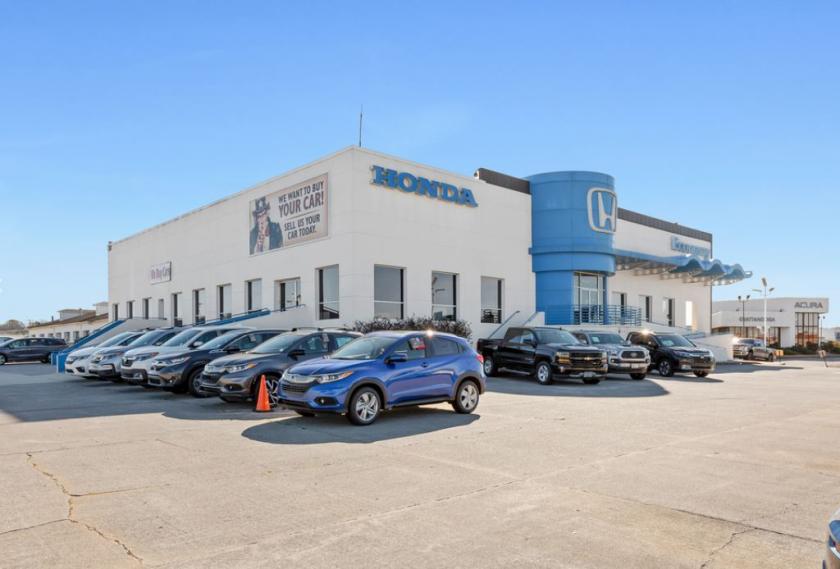
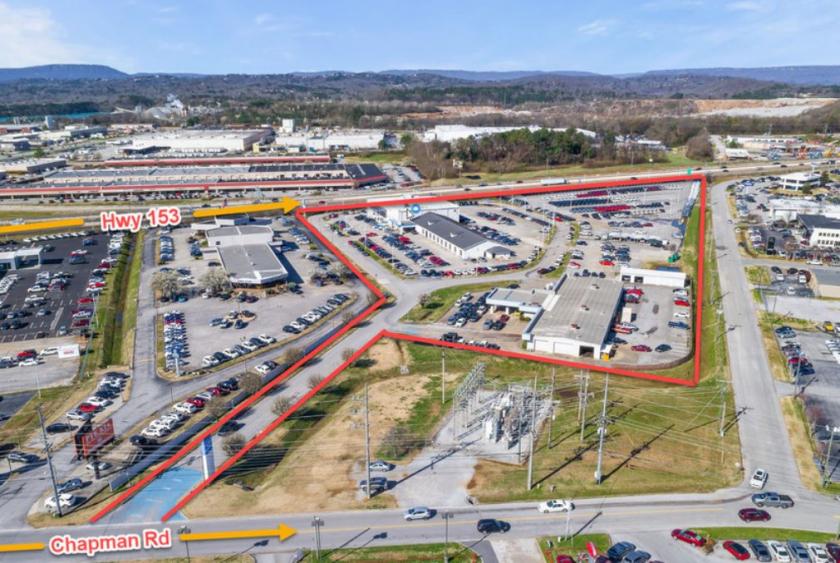
Retail Space
2135 Chapman Road Chattanooga, TN 37421
2135 Chapman Road Chattanooga, TN 37421
Details & Description
Property Highlights
- • You cant beat this location and visibility
- • 11.28 Acres with 56,000 SF
- • 70,000 vpd on Highway 153
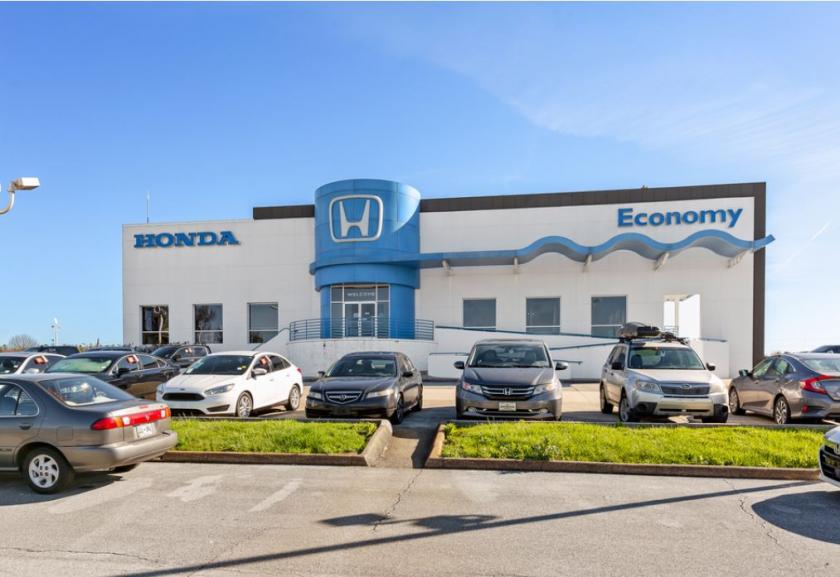
Additional Photos

Listing Agents

Jennie Brockman
O: 423-664-1550
M: 423-400-6399
jennie@brockmans.com
O: 423-664-1550
M: 423-400-6399
jennie@brockmans.com
While we strive to provide the most accurate information, all listing information, and demographic data, is provided by third-parties. As such, MyEListing will not be responsible for the accuracy of the information. It is strongly recommended that you verify all information with the listing agent, and any relevant agencies, prior to making any decisions.


