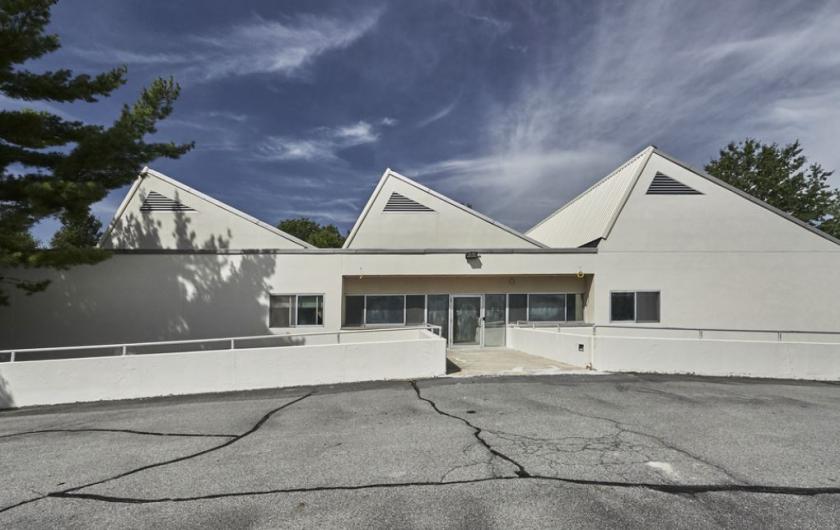
Office Space
78 Cypress Road Goshen, NY 10924
78 Cypress Road Goshen, NY 10924
Details & Description
Property Highlights
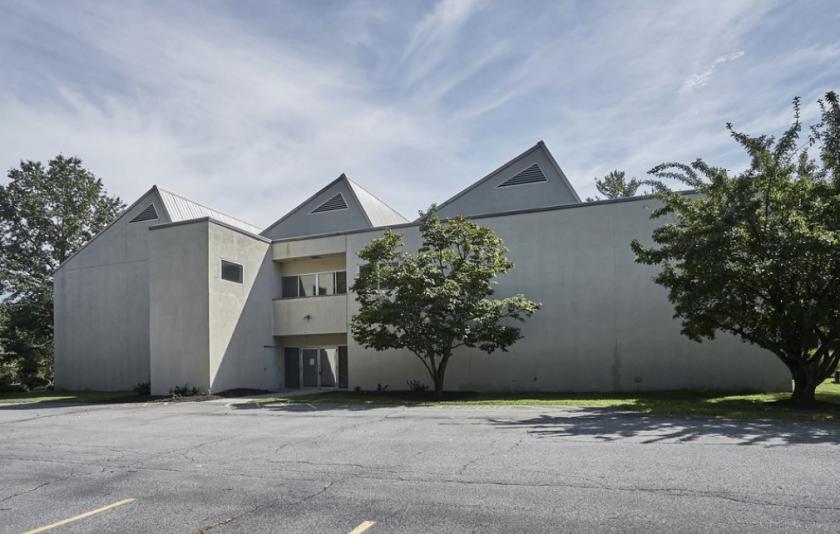
• Built With Passive Solar
• Built With Passive Solar
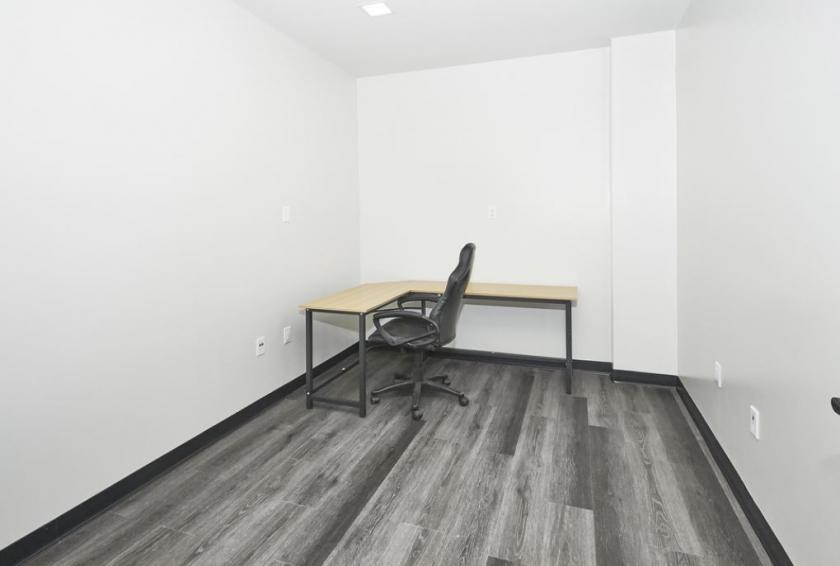
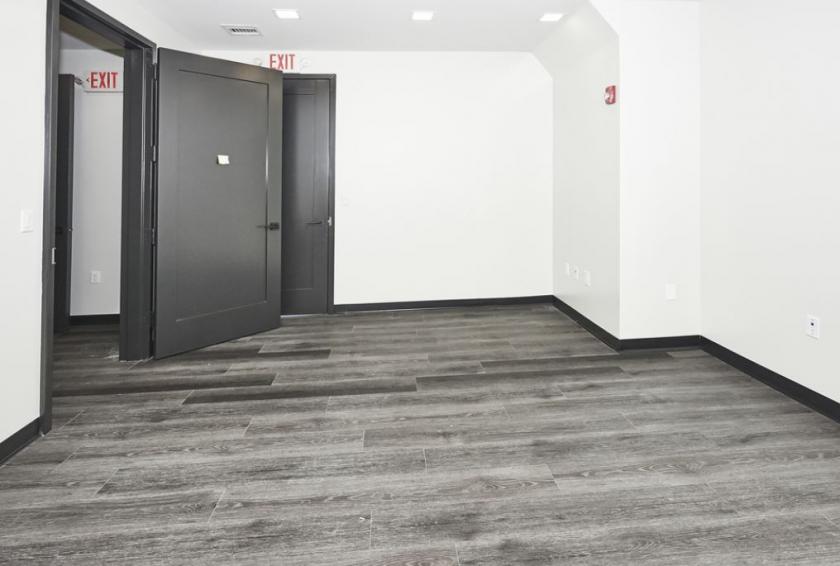
Additional Photos
Listing Agents

Claude Brischoux
KW Commercial
O: 845-928-8000
M: 845-629-4997
hudsonpropertyventures@gmail.com
KW Commercial
O: 845-928-8000
M: 845-629-4997
hudsonpropertyventures@gmail.com
While we strive to provide the most accurate information, all listing information, and demographic data, is provided by third-parties. As such, MyEListing will not be responsible for the accuracy of the information. It is strongly recommended that you verify all information with the listing agent, and any relevant agencies, prior to making any decisions.


