Commercial Land
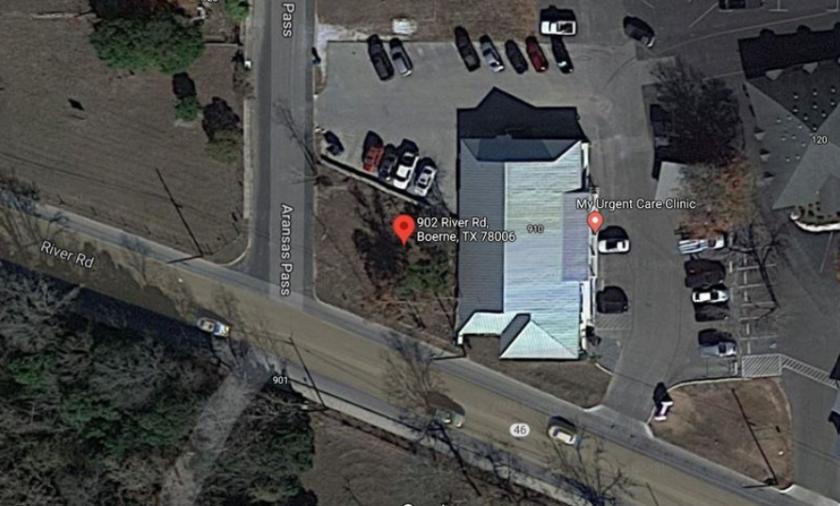
902 River Road Boerne, TX 78006
902 River Road Boerne, TX 78006
Details & Description
Property Highlights
- • 0.098- Commercial Acres For Sale
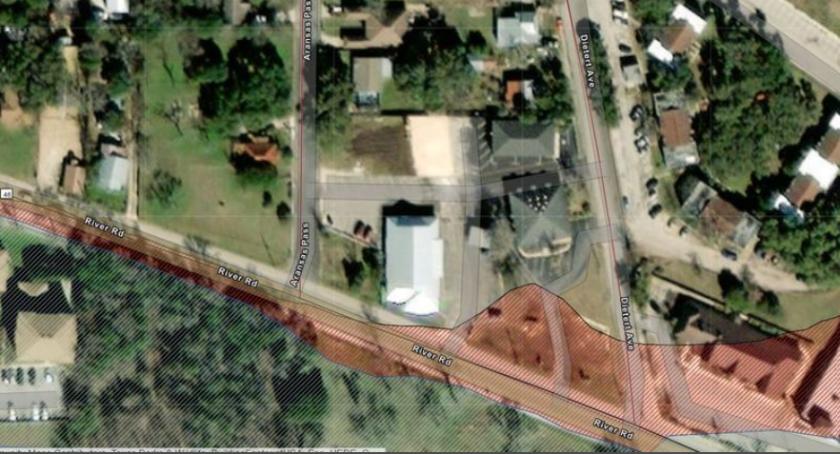
- • Flat with No Flood
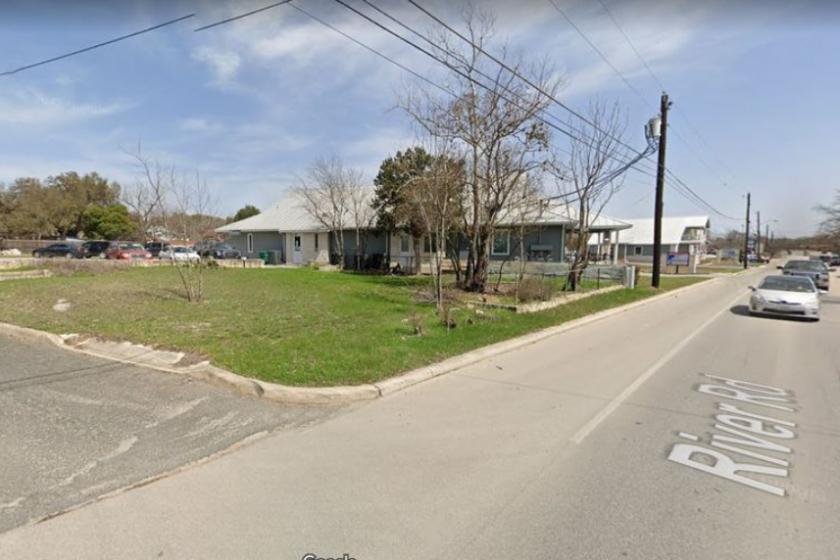
- • Great Boerne TX Location
- • Corner Lot on River Road
- • Ideal for Retail, Office and Others
Listing Agents

Glen Boehm
O: 210-213-6886
M: 830-428-8106
glen@glenboehm.com
O: 210-213-6886
M: 830-428-8106
glen@glenboehm.com
While we strive to provide the most accurate information, all listing information, and demographic data, is provided by third-parties. As such, MyEListing will not be responsible for the accuracy of the information. It is strongly recommended that you verify all information with the listing agent, and any relevant agencies, prior to making any decisions.