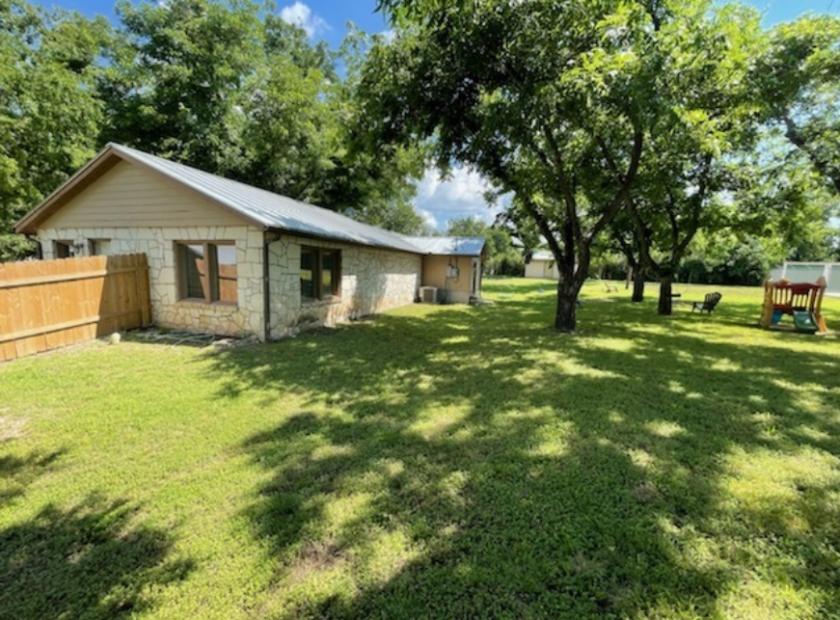
Office Space
1610 Goat Creek Road Kerrville, TX 78028
1610 Goat Creek Road Kerrville, TX 78028

Details & Description
Property Highlights
- • All ADA Compliant
- • Room to Expand
- • Current Tenant On Month-to-Month lease
- • Approximately 3387 SF Building
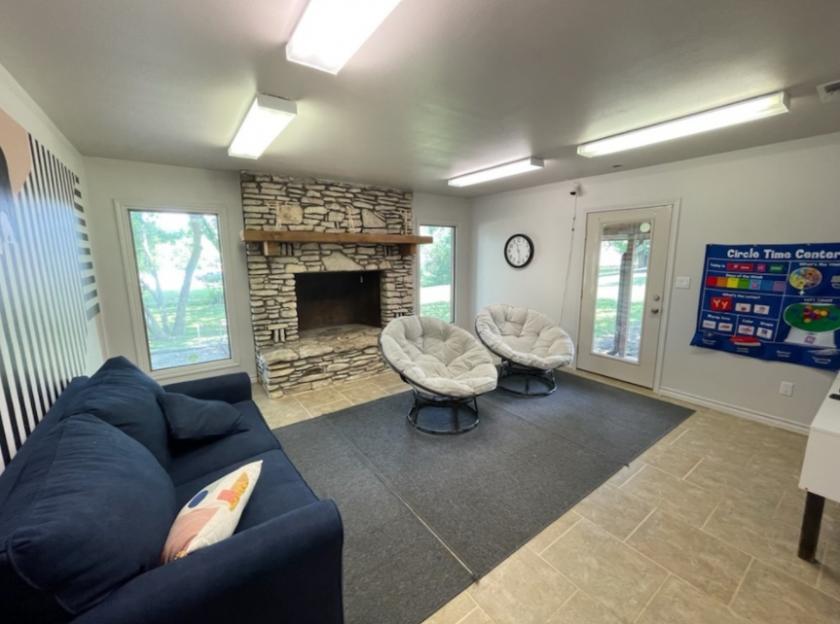
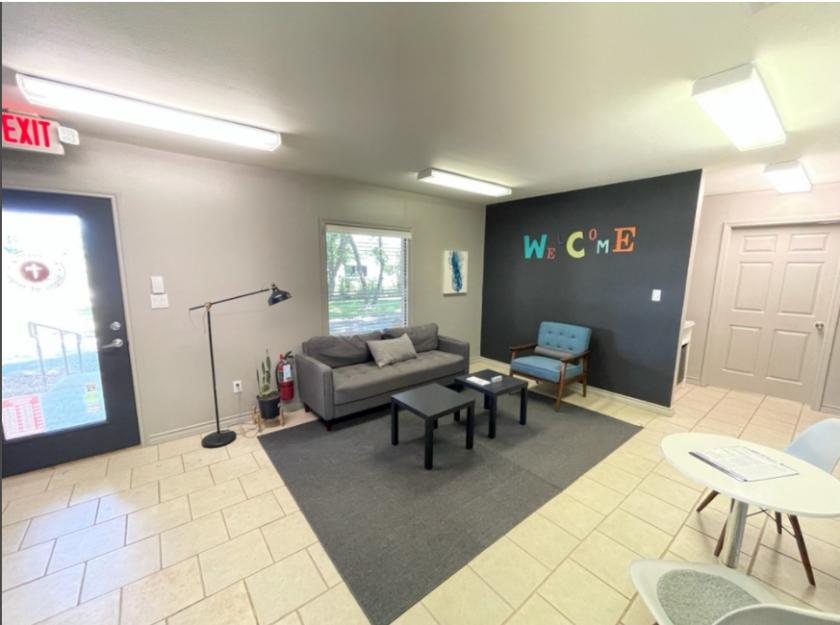
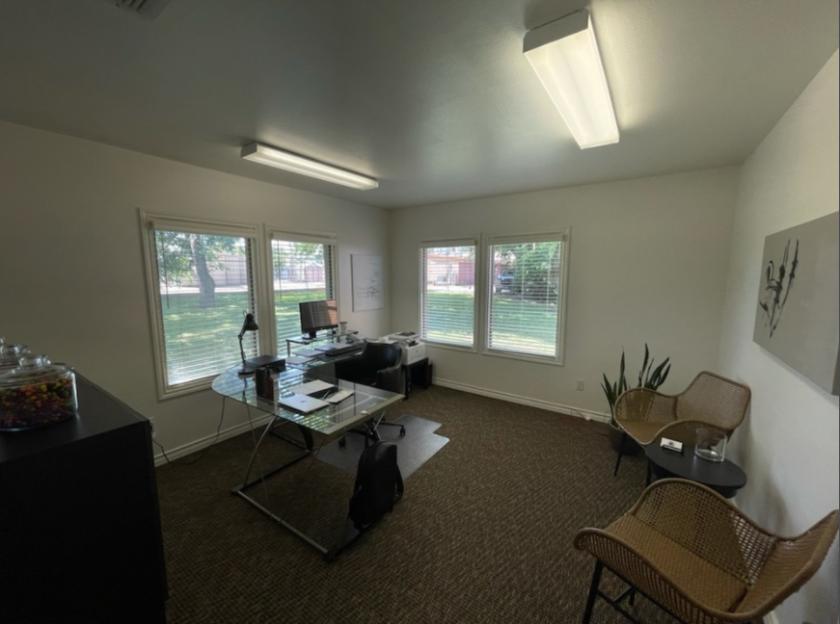
- • Multiple offices, break room, restroom
- • Junction Hwy Visibility
Additional Photos
Listing Agents

Glen Boehm
O: 210-213-6886
M: 830-428-8106
glen@glenboehm.com
O: 210-213-6886
M: 830-428-8106
glen@glenboehm.com
While we strive to provide the most accurate information, all listing information, and demographic data, is provided by third-parties. As such, MyEListing will not be responsible for the accuracy of the information. It is strongly recommended that you verify all information with the listing agent, and any relevant agencies, prior to making any decisions.


