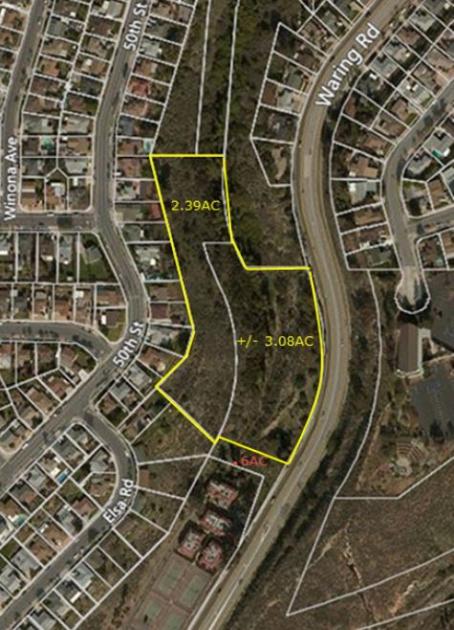
Commercial Land
Waring Road San Diego, CA 92120
Waring Road San Diego, CA 92120
Details & Description
Property Highlights
• Within the San Diego Unified School District Foster Elementary, Lewis Middle School, and Henry High School
• Borders the highly desirable neighborhoods of Grantville, Del Cerro, and Allied Gardens
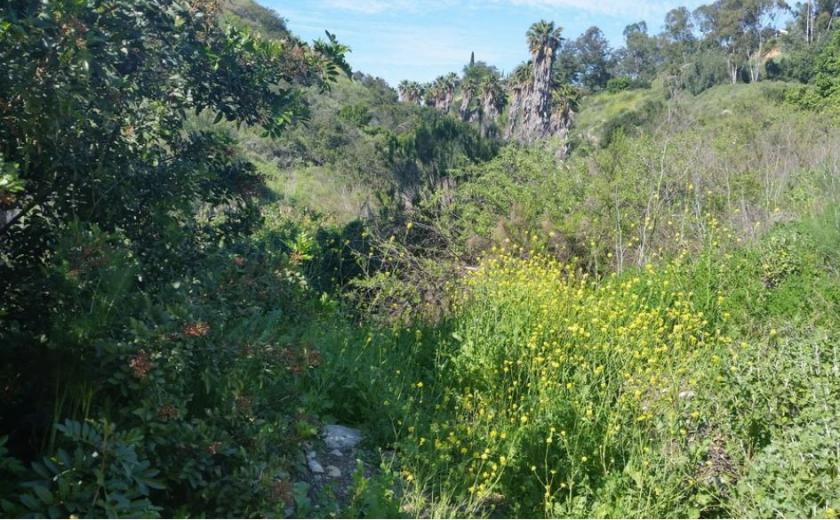
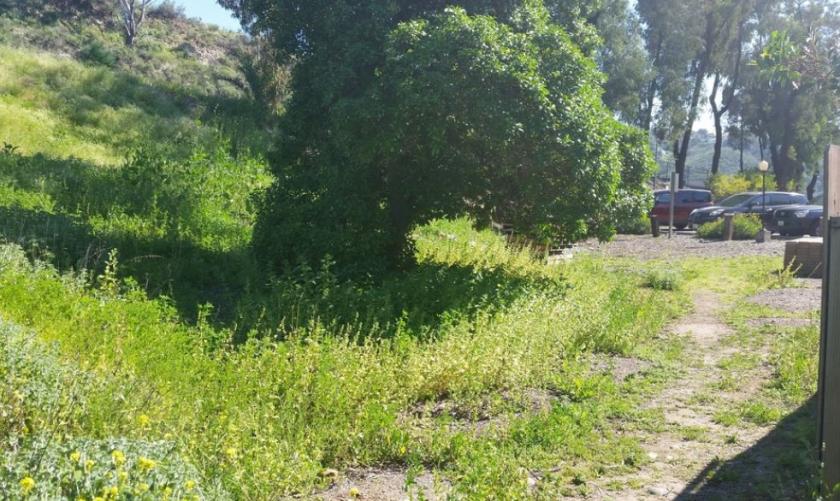
Additional Photos

Listing Agents

Elizabeth Brignon
KW Commercial
O: 619-540-4208
ebrignon@kwcommercial.com
KW Commercial
O: 619-540-4208
ebrignon@kwcommercial.com
While we strive to provide the most accurate information, all listing information, and demographic data, is provided by third-parties. As such, MyEListing will not be responsible for the accuracy of the information. It is strongly recommended that you verify all information with the listing agent, and any relevant agencies, prior to making any decisions.


