Commercial Land
5942 San Miguel Road Bonita, CA 91902
5942 San Miguel Road Bonita, CA 91902
Details & Description
Property Highlights
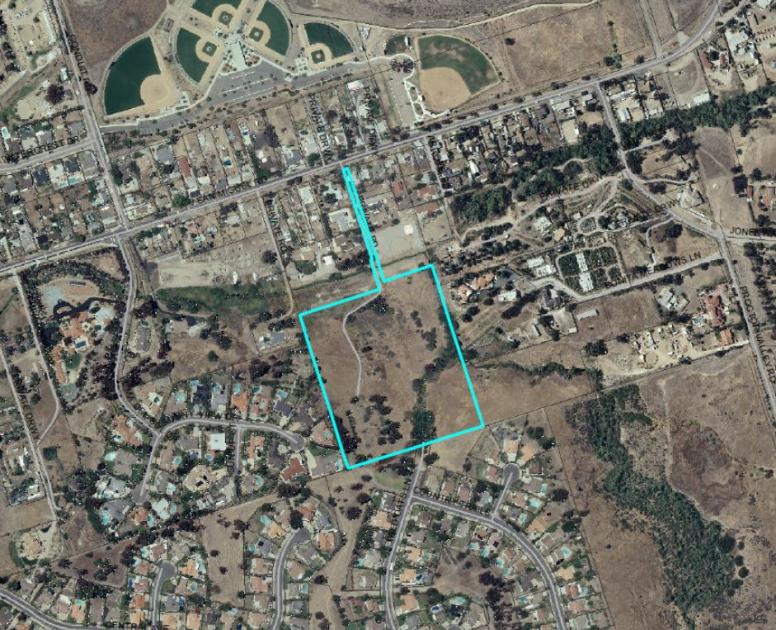
• Multiple access points to the property- CALL BROKER FOR DETAILS
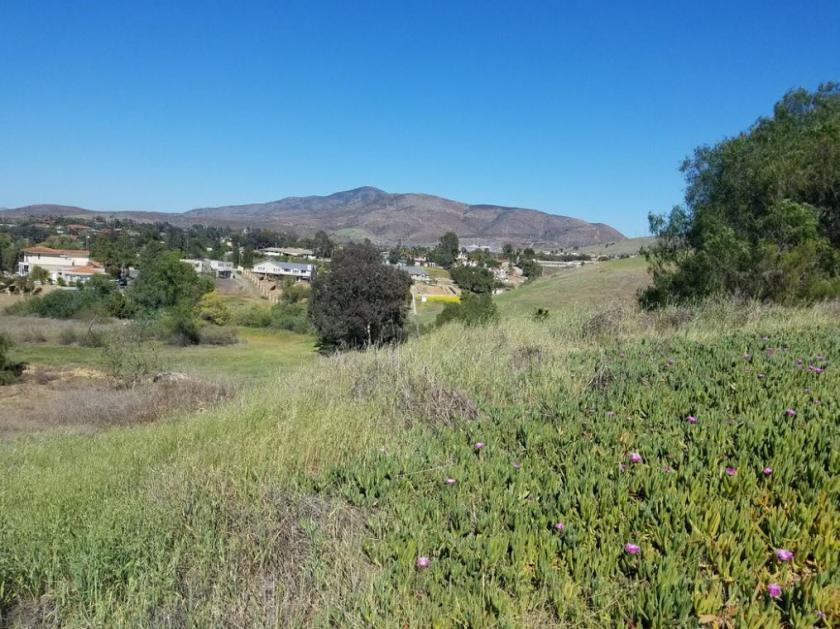
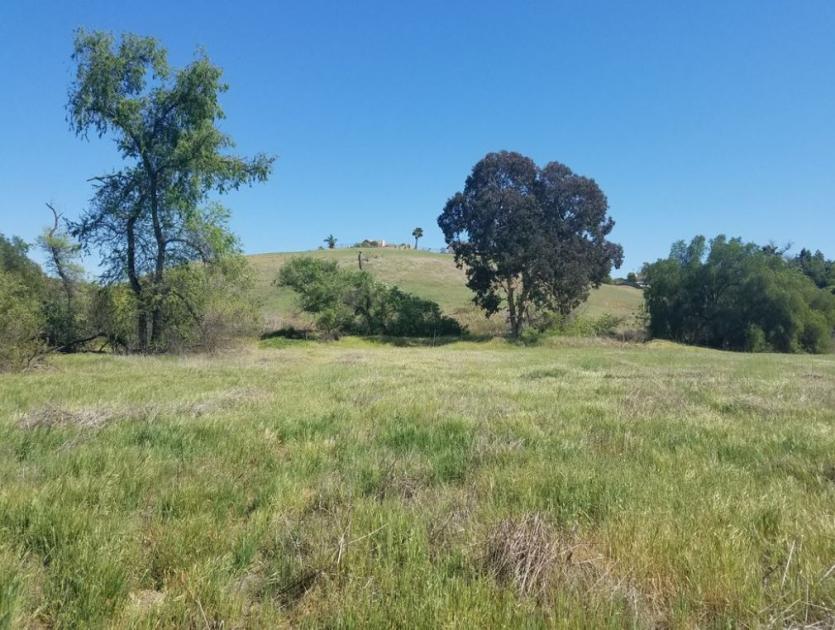
• Located within the Sweetwater River Valley of Bonita
Additional Photos

Listing Agents

Elizabeth Brignon
KW Commercial
O: 619-540-4208
ebrignon@kwcommercial.com
KW Commercial
O: 619-540-4208
ebrignon@kwcommercial.com
While we strive to provide the most accurate information, all listing information, and demographic data, is provided by third-parties. As such, MyEListing will not be responsible for the accuracy of the information. It is strongly recommended that you verify all information with the listing agent, and any relevant agencies, prior to making any decisions.


