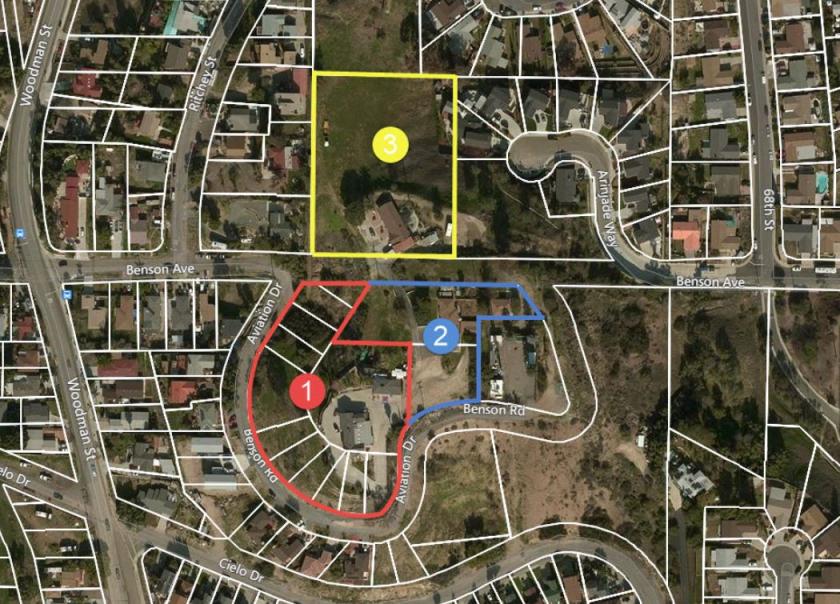
1-Mile | 3-Miles | 5-Miles | ||
---|---|---|---|---|
Total Population | 24,476 | 230,180 | 593,493 | |
Population Median Age | 39 | 37 | 36 | |
Population by Age | 0-9 Yrs | 2644 (10%) | 29324 (12%) | 74657 (12%) |
10-19 Yrs | 3000 (12%) | 31800 (13%) | 80091 (13%) | |
20-29 Yrs | 3981 (16%) | 38097 (16%) | 110209 (18%) | |
30-39 Yrs | 3431 (14%) | 32649 (14%) | 87713 (14%) | |
40-49 Yrs | 2847 (11%) | 27402 (11%) | 69969 (11%) | |
50-59 Yrs | 3154 (12%) | 28027 (12%) | 70354 (11%) | |
60-69 Yrs | 3197 (13%) | 22497 (9%) | 53645 (9%) | |
70+ Yrs | 2222 (9%) | 20384 (8%) | 46855 (7%) | |
Median HH Income | $72,671 | $61,929 | $57,780 | |
Total Household Income | < 24K | 749 (11%) | 11353 (17%) | 35952 (20%) |
25-49K | 1261 (19%) | 14604 (22%) | 41716 (23%) | |
50-74K | 1281 (20%) | 12577 (19%) | 32675 (18%) | |
75-99K | 1047 (16%) | 8774 (13%) | 22740 (12%) | |
100-199K | 1620 (25%) | 14947 (23%) | 36693 (20%) | |
200K+ | 350 (5%) | 2211 (3%) | 8084 (4%) | |
Highest Education Level | No Diploma | 3655 | 33932 | 84392 |
Diploma or GED | 3669 | 37339 | 88323 | |
Some College | 4692 | 39949 | 94257 | |
Assoc. Degree | 1431 | 12695 | 30676 | |
Bachelors Degree | 2964 | 20870 | 58699 | |
Higher Degree | 533 | 7006 | 26990 | |
Total Housing Units | 6,727 | 67,887 | 190,521 | |
--Owner-Occupied | 4,460 | 35,511 | 79,576 | |
--Renter-Occupied | 1,849 | 28,955 | 98,285 | |
Owner-Occupied Values | < 100K | 166 | 1589 | 3038 |
100-199K | 39 | 871 | 2226 | |
200-299K | 325 | 3206 | 6585 | |
300-399K | 1481 | 10503 | 17607 | |
400-499K | 1778 | 13262 | 24088 | |
500K+ | 672 | 6079 | 26033 | |
Total Working Age Population | 20,125 | 181,596 | 472,960 | |
In Work Force | 12,726 | 115,620 | 310,869 | |
Not In Work Force | 7,399 | 65,975 | 162,091 | |
Workforce Employed | 11,352 | 102,928 | 270,535 | |
Workforce Unemployed | 1,181 | 9,933 | 23,060 | |
Civlian Workforce | 12,534 | 112,860 | 293,595 | |
Military Workforce | 192 | 2,760 | 17,274 | |
Total Households | 6,309 | 64,466 | 177,861 | |
Family Households | 5,272 | 50,252 | 125,115 | |
Non-Family Households | 1,037 | 14,214 | 52,746 | |
Married Couple | 3,513 | 32,946 | 81,612 | |
Other Family | 1,760 | 17,306 | 43,502 | |
Married w/Child | 1,292 | 13,978 | 35,552 | |
Single Male w/Child | 132 | 1,935 | 4,978 | |
Single Female w/Child | 448 | 5,599 | 14,955 |
Population Change Last Two Decades - Plus Projection
2000 | % | 2010 | % | 2020 | % | 2030 | |
---|---|---|---|---|---|---|---|
California | 33,871,648 | +10 | 37,253,956 | +9 | 40,467,295 | +8 | 43,631,295 |
San Diego County | 2,813,833 | +10 | 3,095,313 | +10 | 3,390,529 | +6 | 3,608,286 |
Total Working Age Population:
Total Households:
Total Working Age Population:
Total Households:
Total Working Age Population:
Total Households: