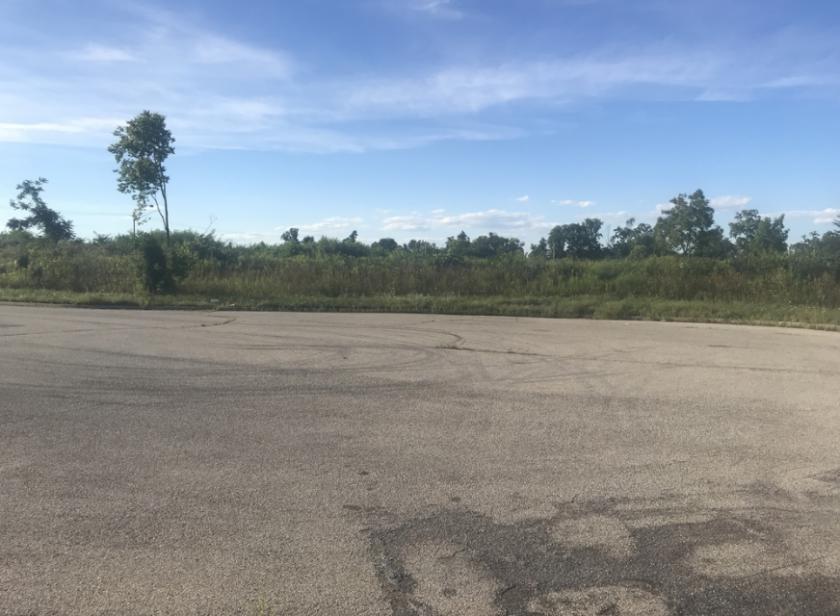
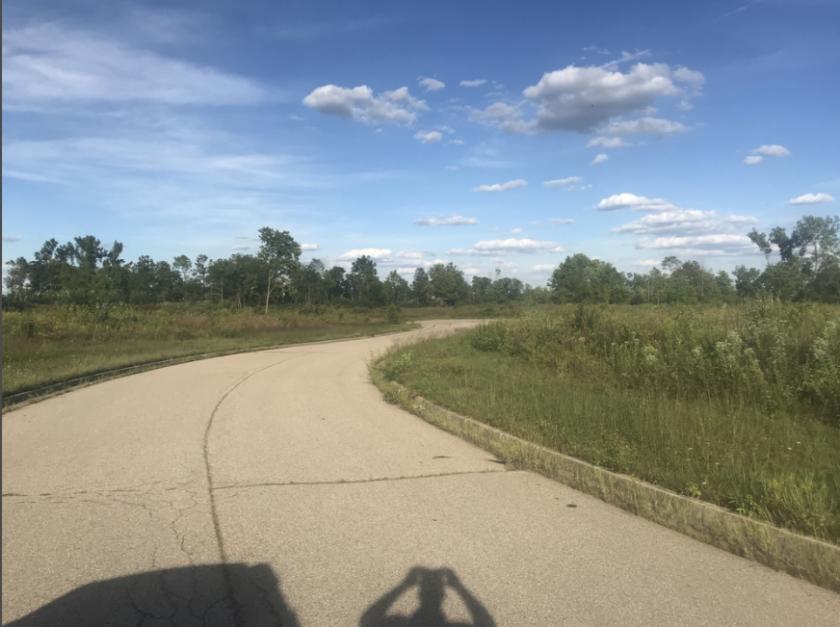
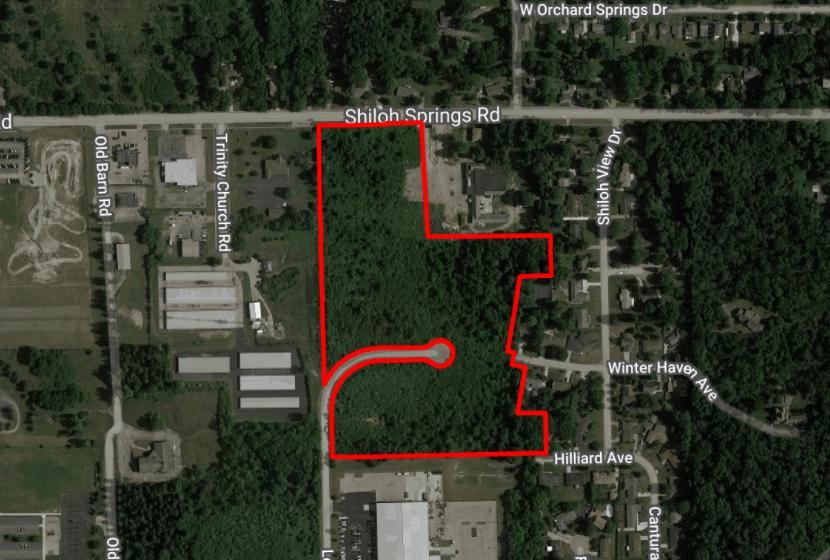
1-Mile | 3-Miles | 5-Miles | ||
---|---|---|---|---|
Total Population | 6,781 | 63,741 | 132,189 | |
Population Median Age | 45 | 41 | 40 | |
Population by Age | 0-9 Yrs | 498 (7%) | 8007 (12%) | 16317 (12%) |
10-19 Yrs | 822 (12%) | 7449 (11%) | 15877 (12%) | |
20-29 Yrs | 886 (13%) | 8109 (12%) | 17128 (12%) | |
30-39 Yrs | 683 (10%) | 7301 (11%) | 16097 (12%) | |
40-49 Yrs | 785 (11%) | 7412 (11%) | 14900 (11%) | |
50-59 Yrs | 922 (13%) | 9204 (14%) | 18973 (14%) | |
60-69 Yrs | 1015 (14%) | 8388 (13%) | 17077 (12%) | |
70+ Yrs | 1170 (17%) | 7872 (12%) | 15820 (11%) | |
Median HH Income | $38,940 | $38,157 | $37,550 | |
Total Household Income | < 24K | 1051 (31%) | 9671 (33%) | 20518 (34%) |
25-49K | 1067 (32%) | 8204 (28%) | 16171 (27%) | |
50-74K | 515 (15%) | 4372 (15%) | 9350 (15%) | |
75-99K | 239 (7%) | 2595 (9%) | 5274 (8%) | |
100-199K | 346 (10%) | 3417 (11%) | 6962 (11%) | |
200K+ | 77 (2%) | 472 (1%) | 1013 (1%) | |
Highest Education Level | No Diploma | 432 | 5177 | 11563 |
Diploma or GED | 1632 | 13321 | 28439 | |
Some College | 1399 | 12158 | 23938 | |
Assoc. Degree | 573 | 4472 | 9062 | |
Bachelors Degree | 620 | 5670 | 11653 | |
Higher Degree | 470 | 3631 | 7085 | |
Total Housing Units | 3,606 | 34,600 | 72,854 | |
--Owner-Occupied | 1,465 | 14,477 | 31,194 | |
--Renter-Occupied | 1,830 | 14,253 | 28,096 | |
Owner-Occupied Values | < 100K | 838 | 8711 | 18276 |
100-199K | 601 | 4680 | 10003 | |
200-299K | 25 | 739 | 2039 | |
300-399K | 0 | 146 | 415 | |
400-499K | 0 | 64 | 152 | |
500K+ | 2 | 139 | 309 | |
Total Working Age Population | 5,820 | 51,379 | 106,438 | |
In Work Force | 3,370 | 31,648 | 64,113 | |
Not In Work Force | 2,451 | 19,731 | 42,325 | |
Workforce Employed | 3,083 | 28,277 | 57,293 | |
Workforce Unemployed | 287 | 3,358 | 6,744 | |
Civlian Workforce | 3,370 | 31,635 | 64,037 | |
Military Workforce | 0 | 14 | 76 | |
Total Households | 3,296 | 28,730 | 59,289 | |
Family Households | 1,698 | 16,040 | 32,840 | |
Non-Family Households | 1,598 | 12,690 | 26,450 | |
Married Couple | 903 | 8,155 | 16,911 | |
Other Family | 795 | 7,885 | 15,929 | |
Married w/Child | 173 | 2,361 | 5,049 | |
Single Male w/Child | 145 | 975 | 1,844 | |
Single Female w/Child | 284 | 3,722 | 7,134 |
Population Change Last Two Decades - Plus Projection
2000 | % | 2010 | % | 2020 | % | 2030 | |
---|---|---|---|---|---|---|---|
Ohio | 11,353,140 | +2 | 11,536,504 | 0 | 11,574,870 | 0 | 11,615,100 |
Miami County | 98,868 | +4 | 102,506 | 0 | 102,590 | +1 | 103,500 |
Montgomery County | 559,062 | -4 | 535,153 | -4 | 513,830 | -3 | 496,650 |
Total Working Age Population:
Total Households:
Total Working Age Population:
Total Households:
Total Working Age Population:
Total Households: