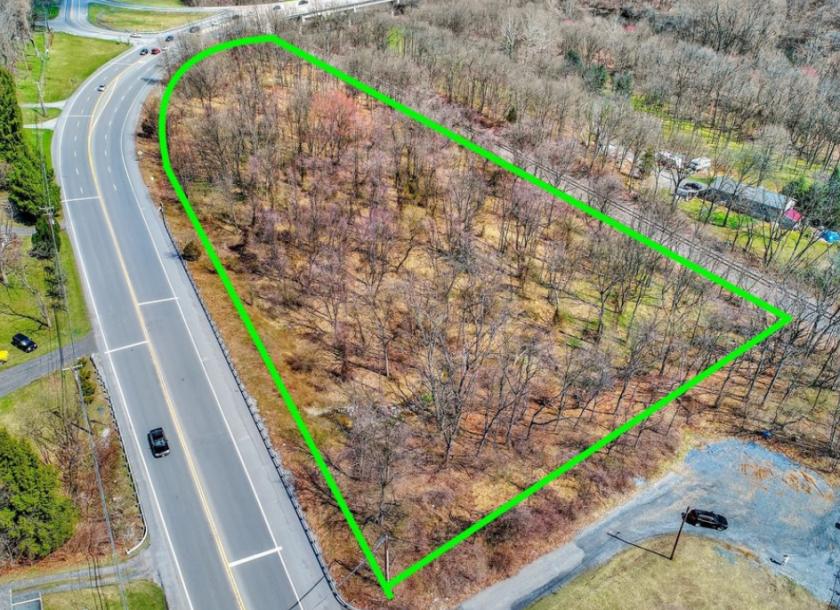
1-Mile | 3-Miles | 5-Miles | ||
---|---|---|---|---|
Total Population | 3,212 | 17,492 | 35,365 | |
Population Median Age | 42 | 42 | 42 | |
Population by Age | 0-9 Yrs | 314 (9%) | 1966 (11%) | 3849 (10%) |
10-19 Yrs | 389 (12%) | 2001 (11%) | 4189 (11%) | |
20-29 Yrs | 383 (11%) | 1973 (11%) | 4065 (11%) | |
30-39 Yrs | 372 (11%) | 1862 (10%) | 3654 (10%) | |
40-49 Yrs | 382 (11%) | 2453 (14%) | 5020 (14%) | |
50-59 Yrs | 463 (14%) | 2830 (16%) | 5797 (16%) | |
60-69 Yrs | 535 (16%) | 2156 (12%) | 4381 (12%) | |
70+ Yrs | 374 (11%) | 2253 (12%) | 4410 (12%) | |
Median HH Income | $59,140 | $60,740 | $66,657 | |
Total Household Income | < 24K | 239 (18%) | 1284 (18%) | 2271 (16%) |
25-49K | 285 (22%) | 1590 (23%) | 2830 (20%) | |
50-74K | 257 (20%) | 1341 (19%) | 2658 (19%) | |
75-99K | 195 (15%) | 796 (11%) | 1691 (12%) | |
100-199K | 251 (19%) | 1594 (23%) | 3577 (26%) | |
200K+ | 32 (2%) | 219 (3%) | 660 (4%) | |
Highest Education Level | No Diploma | 356 | 1558 | 2753 |
Diploma or GED | 981 | 5406 | 10629 | |
Some College | 332 | 1942 | 3789 | |
Assoc. Degree | 224 | 1203 | 2619 | |
Bachelors Degree | 284 | 1567 | 3491 | |
Higher Degree | 138 | 878 | 2122 | |
Total Housing Units | 1,359 | 7,430 | 14,648 | |
--Owner-Occupied | 999 | 5,217 | 11,062 | |
--Renter-Occupied | 260 | 1,606 | 2,625 | |
Owner-Occupied Values | < 100K | 159 | 1163 | 2018 |
100-199K | 574 | 2236 | 4186 | |
200-299K | 197 | 1094 | 2668 | |
300-399K | 43 | 417 | 1274 | |
400-499K | 3 | 119 | 523 | |
500K+ | 23 | 188 | 393 | |
Total Working Age Population | 2,625 | 14,277 | 28,840 | |
In Work Force | 1,600 | 9,079 | 18,741 | |
Not In Work Force | 1,025 | 5,199 | 10,099 | |
Workforce Employed | 1,542 | 8,633 | 17,844 | |
Workforce Unemployed | 58 | 430 | 843 | |
Civlian Workforce | 1,600 | 9,063 | 18,687 | |
Military Workforce | 0 | 16 | 55 | |
Total Households | 1,260 | 6,823 | 13,687 | |
Family Households | 813 | 4,588 | 9,520 | |
Non-Family Households | 446 | 2,236 | 4,167 | |
Married Couple | 640 | 3,458 | 7,465 | |
Other Family | 174 | 1,129 | 2,055 | |
Married w/Child | 247 | 1,235 | 2,672 | |
Single Male w/Child | 20 | 217 | 421 | |
Single Female w/Child | 31 | 242 | 459 |
Population Change Last Two Decades - Plus Projection
2000 | % | 2010 | % | 2020 | % | 2030 | |
---|---|---|---|---|---|---|---|
Pennsylvania | 12,281,054 | +3 | 12,702,379 | +4 | 13,230,170 | +4 | 13,759,594 |
Carbon County | 58,802 | +11 | 65,249 | -2 | 63,692 | -2 | 62,144 |
Lehigh County | 312,090 | +12 | 349,497 | +5 | 365,909 | +5 | 385,431 |
Monroe County | 138,687 | +22 | 169,842 | +3 | 174,721 | +3 | 179,312 |
Northampton County | 267,066 | +11 | 297,735 | +4 | 309,231 | +4 | 321,338 |
Total Working Age Population:
Total Households:
Total Working Age Population:
Total Households:
Total Working Age Population:
Total Households: