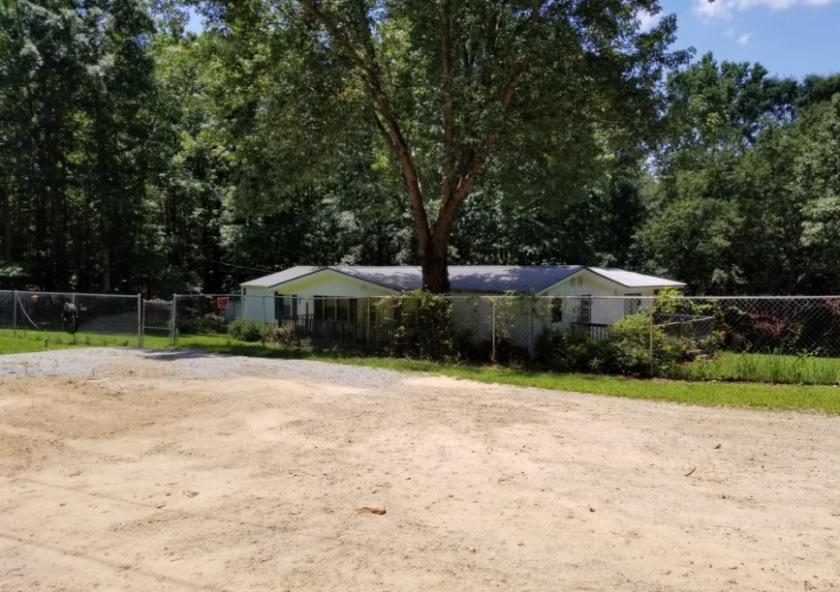
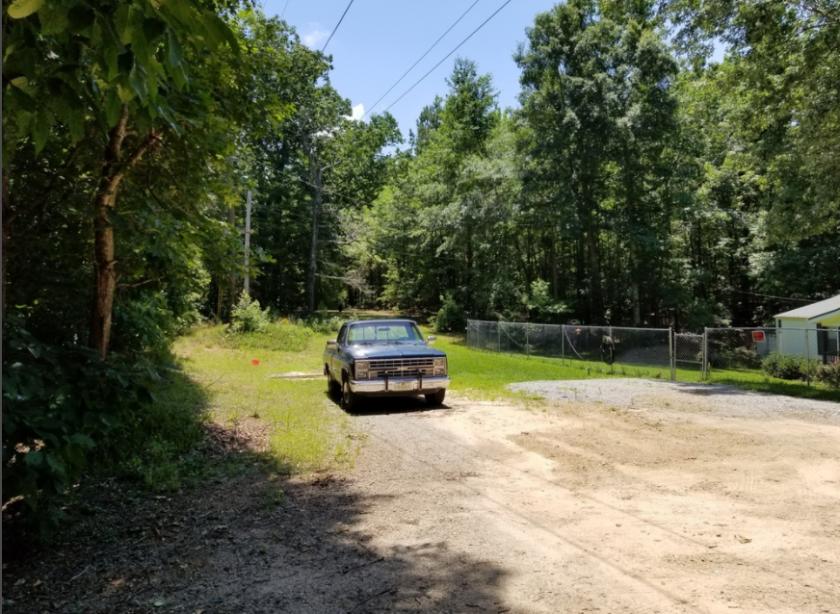
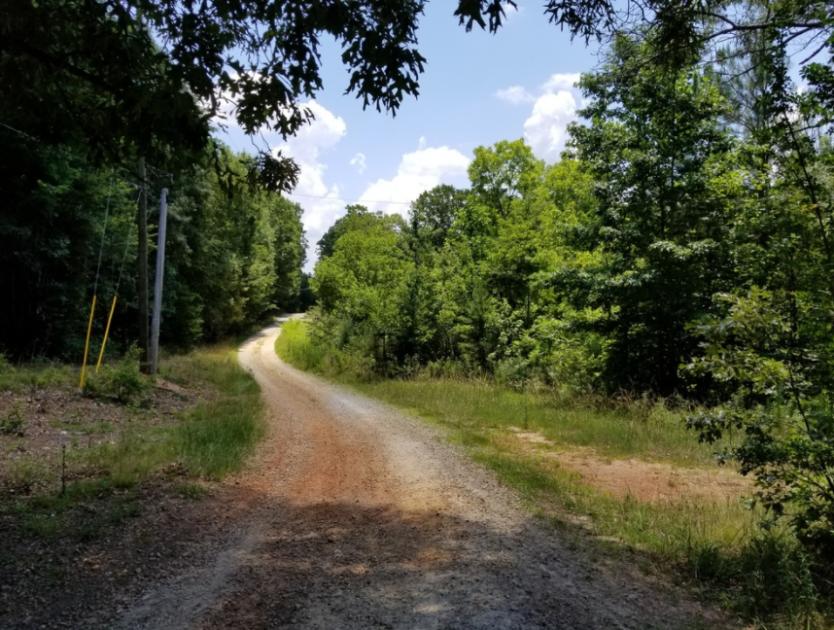
1-Mile | 3-Miles | 5-Miles | ||
---|---|---|---|---|
Total Population | 3,959 | 26,415 | 70,029 | |
Population Median Age | 37 | 38 | 39 | |
Population by Age | 0-9 Yrs | 445 (11%) | 3090 (11%) | 8692 (12%) |
10-19 Yrs | 521 (13%) | 3757 (14%) | 9714 (13%) | |
20-29 Yrs | 707 (17%) | 3591 (13%) | 8865 (12%) | |
30-39 Yrs | 416 (10%) | 3076 (11%) | 8422 (12%) | |
40-49 Yrs | 678 (17%) | 4222 (15%) | 9824 (14%) | |
50-59 Yrs | 570 (14%) | 3950 (14%) | 10184 (14%) | |
60-69 Yrs | 321 (8%) | 2472 (9%) | 7537 (10%) | |
70+ Yrs | 302 (7%) | 2256 (8%) | 6791 (9%) | |
Median HH Income | $75,769 | $79,425 | $80,884 | |
Total Household Income | < 24K | 143 (10%) | 929 (10%) | 2468 (10%) |
25-49K | 270 (19%) | 1704 (19%) | 4205 (18%) | |
50-74K | 274 (19%) | 1589 (17%) | 4016 (17%) | |
75-99K | 236 (16%) | 1421 (15%) | 3726 (16%) | |
100-199K | 413 (29%) | 2683 (29%) | 6626 (28%) | |
200K+ | 52 (3%) | 621 (6%) | 2091 (9%) | |
Highest Education Level | No Diploma | 227 | 1688 | 5478 |
Diploma or GED | 620 | 4430 | 11924 | |
Some College | 727 | 4567 | 11233 | |
Assoc. Degree | 232 | 1605 | 4171 | |
Bachelors Degree | 614 | 3747 | 9539 | |
Higher Degree | 272 | 1852 | 5022 | |
Total Housing Units | 1,528 | 9,824 | 25,092 | |
--Owner-Occupied | 1,010 | 7,039 | 18,879 | |
--Renter-Occupied | 379 | 1,907 | 4,253 | |
Owner-Occupied Values | < 100K | 48 | 550 | 1751 |
100-199K | 431 | 2392 | 5456 | |
200-299K | 304 | 2011 | 5588 | |
300-399K | 111 | 979 | 3208 | |
400-499K | 96 | 501 | 1345 | |
500K+ | 20 | 606 | 1532 | |
Total Working Age Population | 3,177 | 20,897 | 54,922 | |
In Work Force | 2,246 | 14,282 | 36,003 | |
Not In Work Force | 931 | 6,615 | 18,919 | |
Workforce Employed | 2,184 | 13,733 | 34,763 | |
Workforce Unemployed | 62 | 534 | 1,211 | |
Civlian Workforce | 2,246 | 14,268 | 35,974 | |
Military Workforce | 0 | 15 | 29 | |
Total Households | 1,389 | 8,946 | 23,132 | |
Family Households | 1,019 | 6,852 | 18,329 | |
Non-Family Households | 370 | 2,095 | 4,803 | |
Married Couple | 818 | 5,505 | 14,773 | |
Other Family | 201 | 1,346 | 3,556 | |
Married w/Child | 317 | 2,204 | 5,916 | |
Single Male w/Child | 57 | 241 | 471 | |
Single Female w/Child | 68 | 490 | 1,332 |
Population Change Last Two Decades - Plus Projection
2000 | % | 2010 | % | 2020 | % | 2030 | |
---|---|---|---|---|---|---|---|
Georgia | 8,186,453 | +18 | 9,687,653 | +12 | 10,833,472 | +13 | 12,292,423 |
Barrow County | 46,144 | +50 | 69,367 | +25 | 86,383 | +35 | 116,916 |
Forsyth County | 98,407 | +78 | 175,511 | +44 | 252,507 | +35 | 341,646 |
Gwinnett County | 588,448 | +37 | 805,321 | +21 | 971,145 | +21 | 1,175,358 |
Hall County | 139,277 | +29 | 179,684 | +15 | 206,349 | +13 | 232,775 |
Total Working Age Population:
Total Households:
Total Working Age Population:
Total Households:
Total Working Age Population:
Total Households: