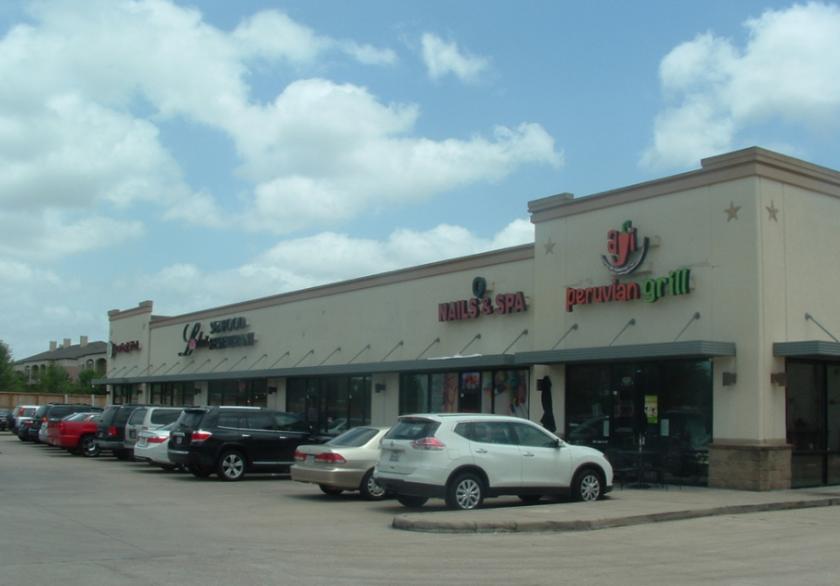
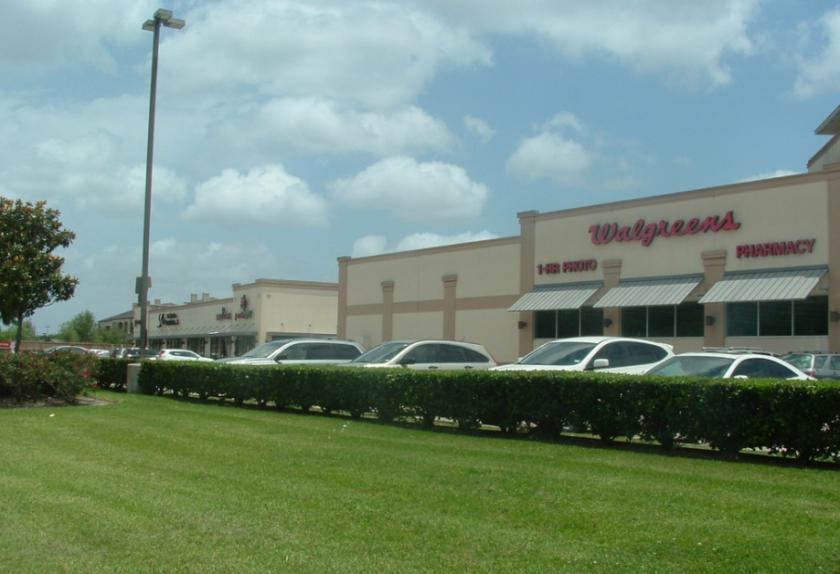
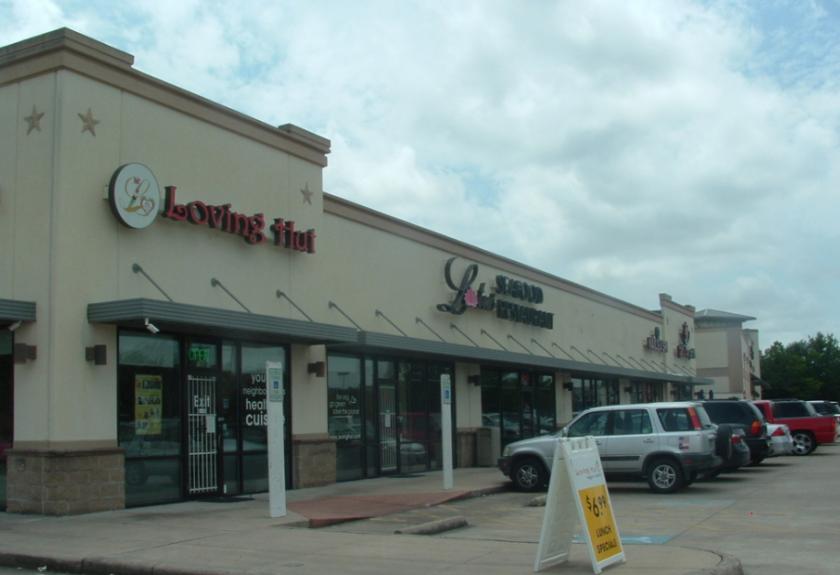
1-Mile | 3-Miles | 5-Miles | ||
---|---|---|---|---|
Total Population | 25,008 | 198,800 | 490,227 | |
Population Median Age | 36 | 35 | 35 | |
Population by Age | 0-9 Yrs | 3329 (13%) | 27490 (13%) | 71922 (14%) |
10-19 Yrs | 2342 (9%) | 24364 (12%) | 63243 (12%) | |
20-29 Yrs | 4455 (17%) | 33595 (16%) | 81726 (16%) | |
30-39 Yrs | 5537 (22%) | 35763 (17%) | 80715 (16%) | |
40-49 Yrs | 3088 (12%) | 25879 (13%) | 65005 (13%) | |
50-59 Yrs | 2445 (9%) | 20985 (10%) | 53077 (10%) | |
60-69 Yrs | 1838 (7%) | 17386 (8%) | 42247 (8%) | |
70+ Yrs | 1973 (7%) | 13339 (6%) | 32292 (6%) | |
Median HH Income | $57,608 | $52,150 | $49,852 | |
Total Household Income | < 24K | 2499 (22%) | 18230 (22%) | 44370 (24%) |
25-49K | 2393 (21%) | 20164 (25%) | 47849 (26%) | |
50-74K | 2127 (19%) | 13580 (17%) | 31363 (17%) | |
75-99K | 1028 (9%) | 8322 (10%) | 18974 (10%) | |
100-199K | 1985 (18%) | 12374 (15%) | 27311 (14%) | |
200K+ | 906 (8%) | 6750 (8%) | 14105 (7%) | |
Highest Education Level | No Diploma | 1397 | 20771 | 58868 |
Diploma or GED | 2684 | 26342 | 69163 | |
Some College | 3710 | 25263 | 59294 | |
Assoc. Degree | 1014 | 8018 | 18998 | |
Bachelors Degree | 5795 | 34538 | 74078 | |
Higher Degree | 3056 | 18336 | 39984 | |
Total Housing Units | 12,500 | 89,970 | 207,378 | |
--Owner-Occupied | 2,606 | 27,329 | 66,676 | |
--Renter-Occupied | 8,332 | 52,091 | 117,296 | |
Owner-Occupied Values | < 100K | 68 | 4423 | 10485 |
100-199K | 418 | 9167 | 25669 | |
200-299K | 753 | 4326 | 9897 | |
300-399K | 776 | 3398 | 5739 | |
400-499K | 144 | 1662 | 3207 | |
500K+ | 447 | 4354 | 11678 | |
Total Working Age Population | 20,324 | 156,415 | 378,280 | |
In Work Force | 14,461 | 109,216 | 260,302 | |
Not In Work Force | 5,863 | 47,199 | 117,978 | |
Workforce Employed | 13,291 | 103,162 | 245,526 | |
Workforce Unemployed | 1,169 | 5,923 | 14,513 | |
Civlian Workforce | 14,461 | 109,086 | 260,039 | |
Military Workforce | 0 | 130 | 263 | |
Total Households | 10,938 | 79,420 | 183,972 | |
Family Households | 6,879 | 48,626 | 116,564 | |
Non-Family Households | 4,059 | 30,793 | 67,409 | |
Married Couple | 4,385 | 31,788 | 75,482 | |
Other Family | 2,494 | 16,838 | 41,082 | |
Married w/Child | 1,585 | 14,544 | 35,496 | |
Single Male w/Child | 251 | 1,307 | 4,358 | |
Single Female w/Child | 1,058 | 7,780 | 18,663 |
Population Change Last Two Decades - Plus Projection
2000 | % | 2010 | % | 2020 | % | 2030 | |
---|---|---|---|---|---|---|---|
Texas | 20,851,820 | +21 | 25,145,561 | +18 | 29,677,668 | +18 | 34,894,452 |
Fort Bend County | 354,452 | +65 | 585,375 | +44 | 840,383 | +43 | 1,203,029 |
Harris County | 3,400,578 | +20 | 4,092,459 | +22 | 4,978,845 | +19 | 5,924,750 |
Total Working Age Population:
Total Households:
Total Working Age Population:
Total Households:
Total Working Age Population:
Total Households: