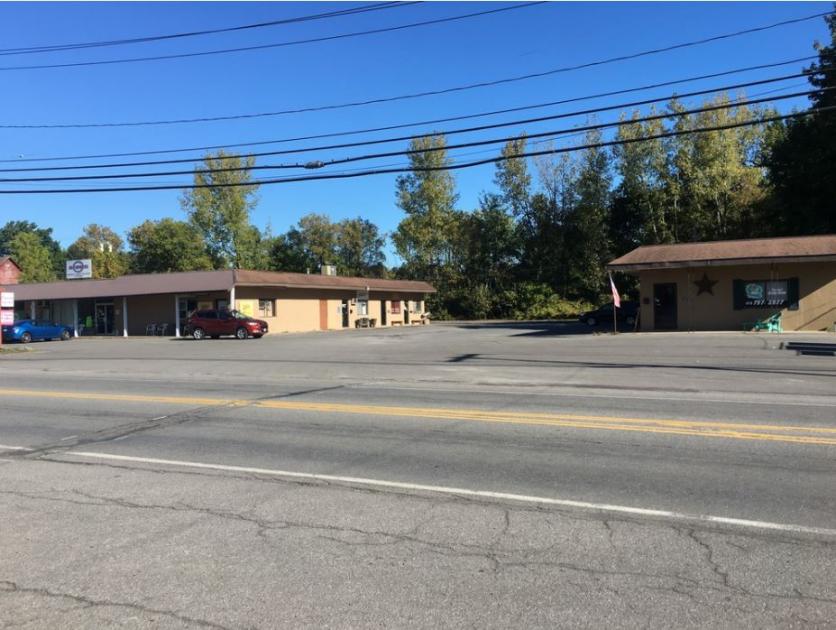
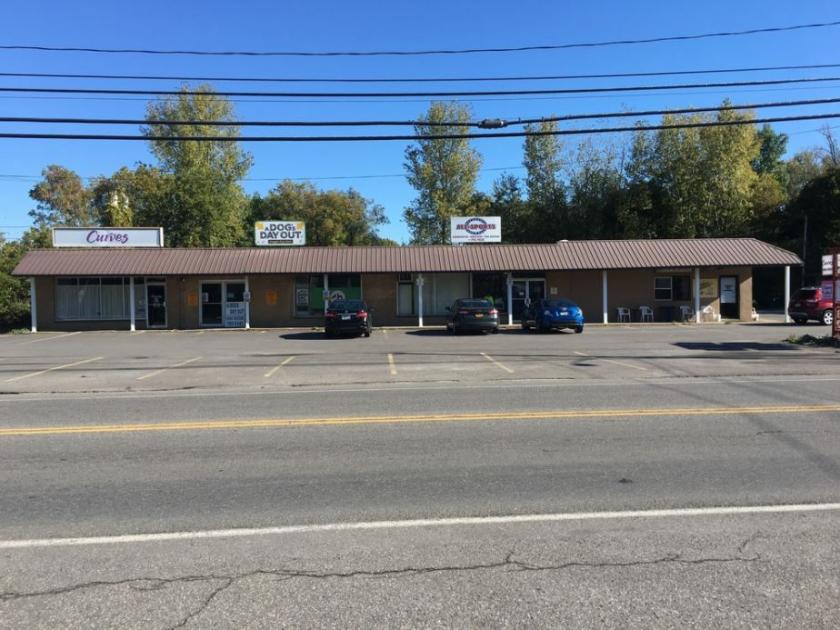
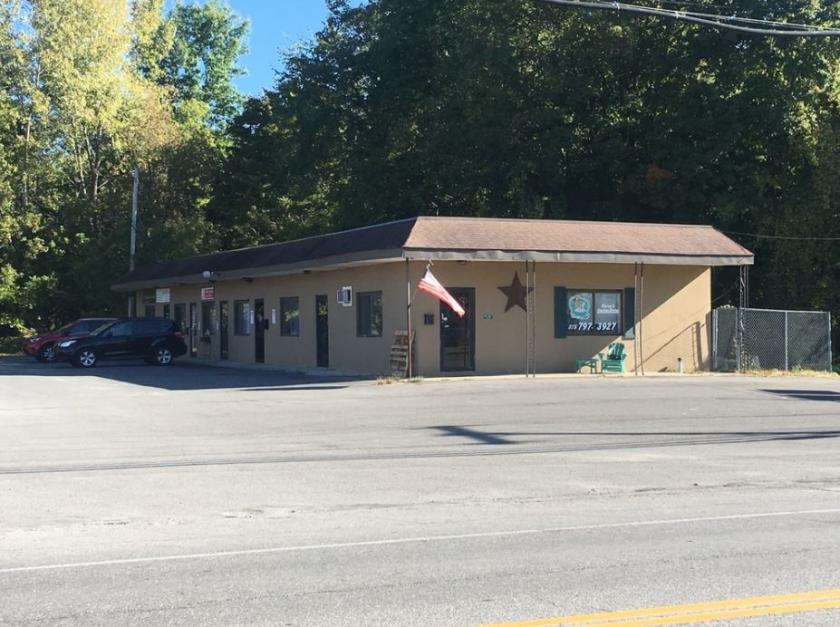
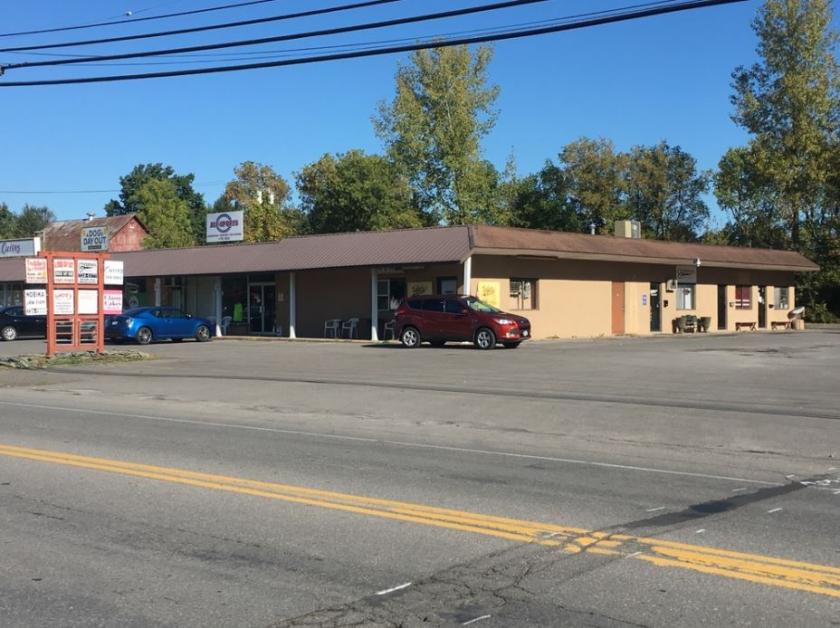
1-Mile | 3-Miles | 5-Miles | ||
---|---|---|---|---|
Total Population | 1,613 | 55,370 | 94,630 | |
Population Median Age | 38 | 36 | 39 | |
Population by Age | 0-9 Yrs | 180 (11%) | 8116 (14%) | 11657 (12%) |
10-19 Yrs | 186 (11%) | 8382 (15%) | 12734 (13%) | |
20-29 Yrs | 376 (23%) | 8935 (16%) | 13992 (14%) | |
30-39 Yrs | 155 (9%) | 6830 (12%) | 11399 (12%) | |
40-49 Yrs | 115 (7%) | 6375 (11%) | 11471 (12%) | |
50-59 Yrs | 259 (16%) | 6321 (11%) | 11966 (12%) | |
60-69 Yrs | 162 (10%) | 5358 (9%) | 10321 (10%) | |
70+ Yrs | 181 (11%) | 5052 (9%) | 11090 (11%) | |
Median HH Income | $71,926 | $36,997 | $46,491 | |
Total Household Income | < 24K | 65 (10%) | 7166 (34%) | 9870 (27%) |
25-49K | 136 (22%) | 5824 (28%) | 9304 (25%) | |
50-74K | 116 (19%) | 3030 (14%) | 6029 (16%) | |
75-99K | 96 (16%) | 1907 (9%) | 3985 (11%) | |
100-199K | 185 (30%) | 2332 (11%) | 5680 (15%) | |
200K+ | 2 (0%) | 419 (2%) | 1195 (3%) | |
Highest Education Level | No Diploma | 33 | 6803 | 9806 |
Diploma or GED | 268 | 10769 | 18515 | |
Some College | 196 | 6207 | 11507 | |
Assoc. Degree | 184 | 3979 | 7263 | |
Bachelors Degree | 177 | 3793 | 9099 | |
Higher Degree | 121 | 2074 | 6450 | |
Total Housing Units | 730 | 25,349 | 42,561 | |
--Owner-Occupied | 448 | 9,768 | 20,961 | |
--Renter-Occupied | 152 | 10,911 | 15,102 | |
Owner-Occupied Values | < 100K | 105 | 5351 | 8470 |
100-199K | 315 | 3219 | 8695 | |
200-299K | 14 | 423 | 2007 | |
300-399K | 3 | 238 | 774 | |
400-499K | 9 | 121 | 343 | |
500K+ | 2 | 415 | 673 | |
Total Working Age Population | 1,377 | 42,624 | 75,927 | |
In Work Force | 770 | 24,315 | 43,079 | |
Not In Work Force | 607 | 18,309 | 32,848 | |
Workforce Employed | 734 | 22,126 | 40,129 | |
Workforce Unemployed | 37 | 2,159 | 2,882 | |
Civlian Workforce | 770 | 24,285 | 43,011 | |
Military Workforce | 0 | 30 | 68 | |
Total Households | 600 | 20,679 | 36,063 | |
Family Households | 373 | 11,937 | 21,301 | |
Non-Family Households | 227 | 8,742 | 14,762 | |
Married Couple | 289 | 6,536 | 13,448 | |
Other Family | 84 | 5,401 | 7,853 | |
Married w/Child | 103 | 2,884 | 5,250 | |
Single Male w/Child | 0 | 583 | 794 | |
Single Female w/Child | 22 | 2,699 | 3,659 |
Population Change Last Two Decades - Plus Projection
2000 | % | 2010 | % | 2020 | % | 2030 | |
---|---|---|---|---|---|---|---|
New York | 18,976,457 | +2 | 19,378,102 | +4 | 20,146,131 | +2 | 20,604,030 |
Herkimer County | 64,427 | 0 | 64,519 | -4 | 61,970 | -3 | 60,367 |
Madison County | 69,441 | +6 | 73,442 | -5 | 69,989 | -4 | 67,257 |
Oneida County | 235,469 | 0 | 234,878 | -2 | 230,608 | -1 | 227,622 |
Total Working Age Population:
Total Households:
Total Working Age Population:
Total Households:
Total Working Age Population:
Total Households: