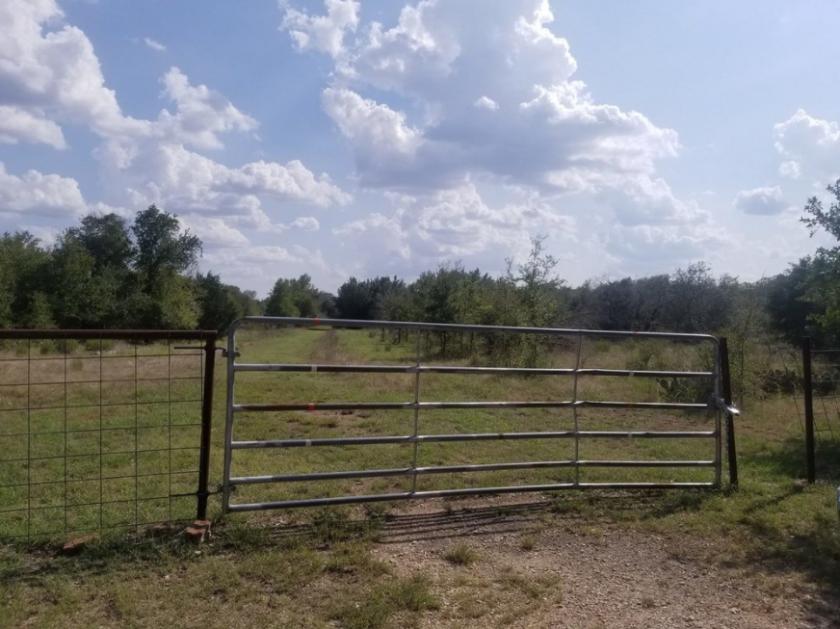
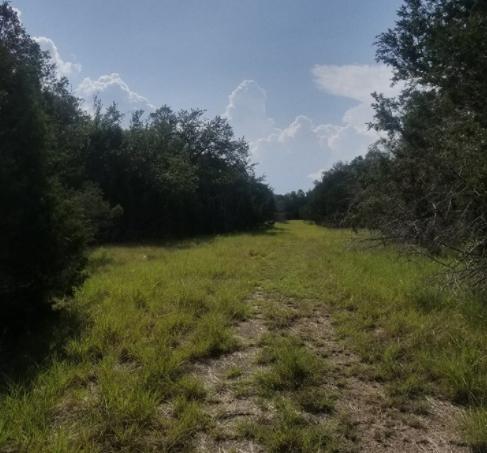
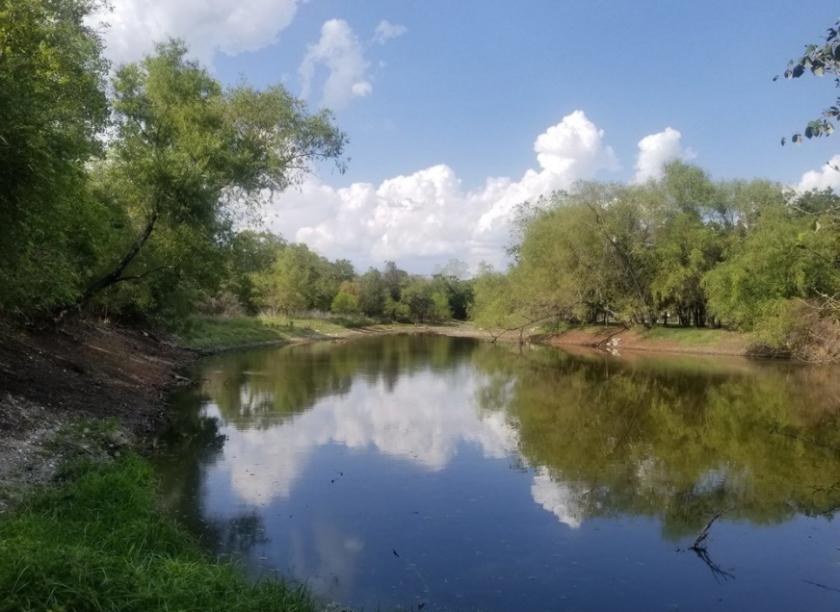
1-Mile | 3-Miles | 5-Miles | ||
---|---|---|---|---|
Total Population | 124 | 2,087 | 11,690 | |
Population Median Age | 40 | 39 | 37 | |
Population by Age | 0-9 Yrs | 14 (11%) | 282 (13%) | 2023 (17%) |
10-19 Yrs | 20 (16%) | 296 (14%) | 1612 (13%) | |
20-29 Yrs | 10 (8%) | 152 (7%) | 977 (8%) | |
30-39 Yrs | 14 (11%) | 261 (12%) | 1487 (12%) | |
40-49 Yrs | 18 (14%) | 340 (16%) | 1951 (16%) | |
50-59 Yrs | 19 (15%) | 262 (12%) | 1328 (11%) | |
60-69 Yrs | 20 (16%) | 294 (14%) | 1238 (10%) | |
70+ Yrs | 9 (7%) | 200 (9%) | 1073 (9%) | |
Median HH Income | $94,832 | $90,302 | $87,330 | |
Total Household Income | < 24K | 4 (9%) | 71 (9%) | 503 (12%) |
25-49K | 3 (7%) | 108 (14%) | 496 (12%) | |
50-74K | 6 (14%) | 90 (12%) | 536 (13%) | |
75-99K | 9 (21%) | 153 (21%) | 832 (21%) | |
100-199K | 13 (31%) | 204 (28%) | 1094 (28%) | |
200K+ | 6 (14%) | 99 (13%) | 429 (11%) | |
Highest Education Level | No Diploma | 8 | 74 | 394 |
Diploma or GED | 19 | 351 | 1853 | |
Some College | 17 | 294 | 1704 | |
Assoc. Degree | 11 | 147 | 758 | |
Bachelors Degree | 15 | 347 | 1707 | |
Higher Degree | 13 | 213 | 1193 | |
Total Housing Units | 44 | 795 | 4,246 | |
--Owner-Occupied | 35 | 585 | 3,016 | |
--Renter-Occupied | 5 | 139 | 874 | |
Owner-Occupied Values | < 100K | 7 | 80 | 408 |
100-199K | 5 | 88 | 678 | |
200-299K | 9 | 166 | 881 | |
300-399K | 7 | 127 | 552 | |
400-499K | 2 | 40 | 185 | |
500K+ | 6 | 85 | 312 | |
Total Working Age Population | 96 | 1,608 | 8,603 | |
In Work Force | 64 | 1,045 | 5,492 | |
Not In Work Force | 32 | 563 | 3,111 | |
Workforce Employed | 57 | 943 | 4,807 | |
Workforce Unemployed | 5 | 64 | 297 | |
Civlian Workforce | 62 | 1,007 | 5,103 | |
Military Workforce | 2 | 37 | 389 | |
Total Households | 41 | 724 | 3,890 | |
Family Households | 31 | 562 | 3,018 | |
Non-Family Households | 9 | 162 | 873 | |
Married Couple | 27 | 486 | 2,546 | |
Other Family | 4 | 76 | 472 | |
Married w/Child | 11 | 173 | 1,141 | |
Single Male w/Child | 1 | 28 | 85 | |
Single Female w/Child | 0 | 14 | 175 |
Population Change Last Two Decades - Plus Projection
2000 | % | 2010 | % | 2020 | % | 2030 | |
---|---|---|---|---|---|---|---|
Texas | 20,851,820 | +21 | 25,145,561 | +18 | 29,677,668 | +18 | 34,894,452 |
Bell County | 237,974 | +30 | 310,235 | +14 | 353,629 | +12 | 396,782 |
Total Working Age Population:
Total Households:
Total Working Age Population:
Total Households:
Total Working Age Population:
Total Households: