Commercial Land
Sunhill Ct Troy, TX 76579
Sunhill Ct Troy, TX 76579
Details & Description
Property Highlights
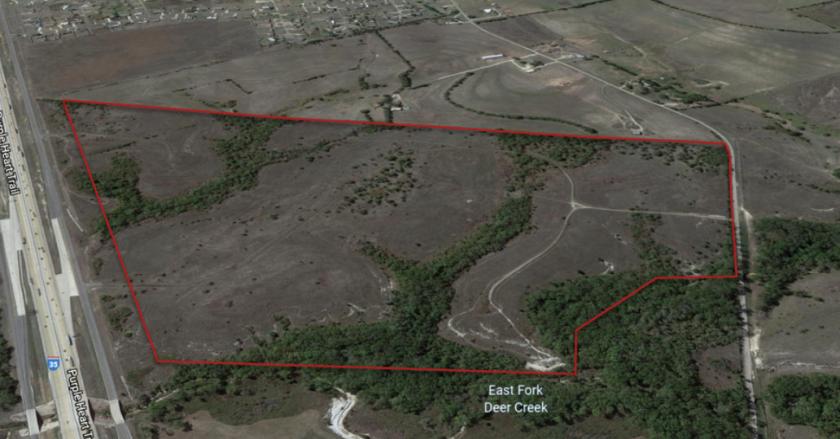
- • Location Interstate 35 in between Troy and Waco.
- • Sales Price $20,000 acre
- • Size 160.65
Listing Agents

Courtney Bassi
O: 254-833-3817
ladypeshkova@gmail.com
O: 254-833-3817
ladypeshkova@gmail.com
While we strive to provide the most accurate information, all listing information, and demographic data, is provided by third-parties. As such, MyEListing will not be responsible for the accuracy of the information. It is strongly recommended that you verify all information with the listing agent, and any relevant agencies, prior to making any decisions.


