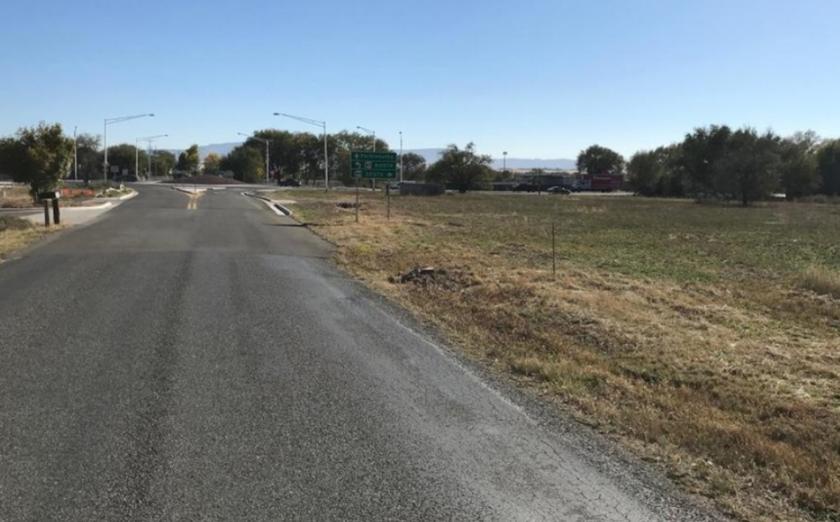
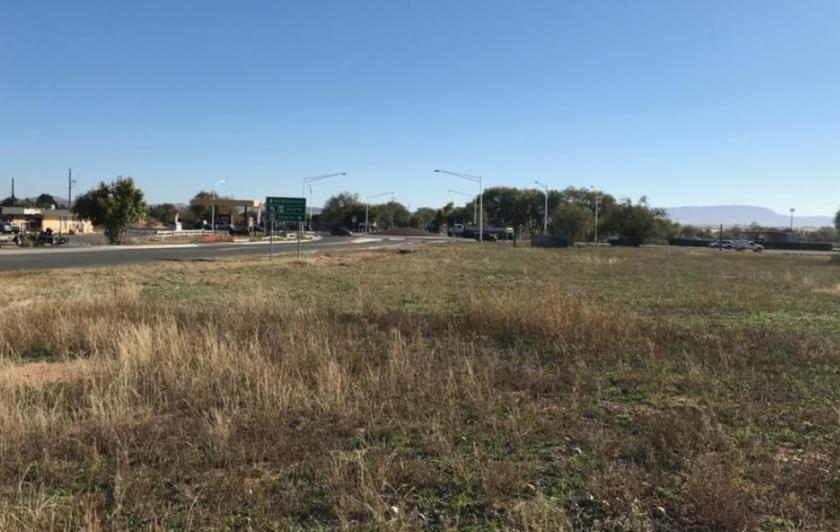
1-Mile | 3-Miles | 5-Miles | ||
---|---|---|---|---|
Total Population | 1,865 | 10,006 | 13,227 | |
Population Median Age | 46 | 45 | 46 | |
Population by Age | 0-9 Yrs | 238 (12%) | 1260 (12%) | 1548 (11%) |
10-19 Yrs | 169 (9%) | 793 (7%) | 1068 (8%) | |
20-29 Yrs | 126 (6%) | 960 (9%) | 1167 (8%) | |
30-39 Yrs | 178 (9%) | 996 (9%) | 1288 (9%) | |
40-49 Yrs | 139 (7%) | 744 (7%) | 1044 (7%) | |
50-59 Yrs | 369 (19%) | 1758 (17%) | 2261 (17%) | |
60-69 Yrs | 307 (16%) | 1774 (17%) | 2480 (18%) | |
70+ Yrs | 339 (18%) | 1720 (17%) | 2371 (17%) | |
Median HH Income | $43,349 | $46,395 | $48,354 | |
Total Household Income | < 24K | 213 (25%) | 896 (21%) | 1103 (19%) |
25-49K | 280 (33%) | 1366 (32%) | 1763 (31%) | |
50-74K | 173 (20%) | 966 (23%) | 1261 (22%) | |
75-99K | 111 (13%) | 612 (14%) | 813 (14%) | |
100-199K | 45 (5%) | 333 (7%) | 561 (10%) | |
200K+ | 0 (0%) | 10 (0%) | 43 (0%) | |
Highest Education Level | No Diploma | 238 | 1056 | 1228 |
Diploma or GED | 402 | 2286 | 3085 | |
Some College | 499 | 2529 | 3269 | |
Assoc. Degree | 87 | 814 | 1185 | |
Bachelors Degree | 123 | 662 | 952 | |
Higher Degree | 36 | 247 | 431 | |
Total Housing Units | 878 | 4,615 | 6,143 | |
--Owner-Occupied | 538 | 3,091 | 4,267 | |
--Renter-Occupied | 286 | 1,092 | 1,277 | |
Owner-Occupied Values | < 100K | 162 | 622 | 763 |
100-199K | 138 | 884 | 1112 | |
200-299K | 91 | 757 | 1083 | |
300-399K | 129 | 610 | 862 | |
400-499K | 11 | 87 | 209 | |
500K+ | 8 | 131 | 238 | |
Total Working Age Population | 1,518 | 8,256 | 11,014 | |
In Work Force | 791 | 4,018 | 5,233 | |
Not In Work Force | 727 | 4,238 | 5,780 | |
Workforce Employed | 739 | 3,793 | 4,940 | |
Workforce Unemployed | 52 | 209 | 277 | |
Civlian Workforce | 791 | 4,002 | 5,217 | |
Military Workforce | 0 | 16 | 16 | |
Total Households | 824 | 4,183 | 5,543 | |
Family Households | 448 | 2,610 | 3,512 | |
Non-Family Households | 375 | 1,573 | 2,031 | |
Married Couple | 329 | 1,905 | 2,624 | |
Other Family | 119 | 705 | 889 | |
Married w/Child | 64 | 403 | 552 | |
Single Male w/Child | 3 | 108 | 169 | |
Single Female w/Child | 68 | 181 | 196 |
Population Change Last Two Decades - Plus Projection
2000 | % | 2010 | % | 2020 | % | 2030 | |
---|---|---|---|---|---|---|---|
Arizona | 5,130,632 | +25 | 6,392,017 | +14 | 7,286,100 | +14 | 8,284,900 |
Coconino County | 116,320 | +16 | 134,421 | +10 | 148,400 | +6 | 157,800 |
Mohave County | 155,032 | +29 | 200,186 | +9 | 218,300 | +11 | 242,700 |
Yavapai County | 167,517 | +26 | 211,033 | +11 | 234,400 | +9 | 256,400 |
Total Working Age Population:
Total Households:
Total Working Age Population:
Total Households:
Total Working Age Population:
Total Households: