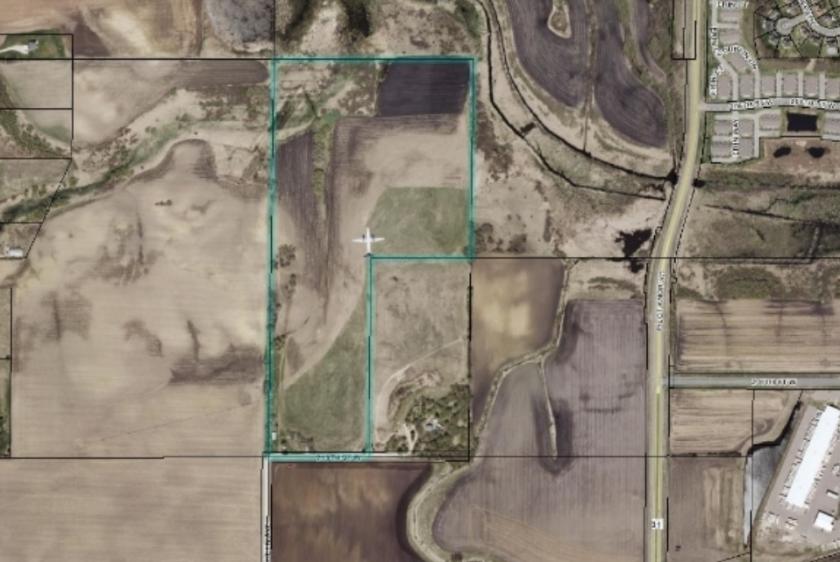
1-Mile | 3-Miles | 5-Miles | ||
---|---|---|---|---|
Total Population | 2,679 | 24,433 | 68,360 | |
Population Median Age | 35 | 35 | 34 | |
Population by Age | 0-9 Yrs | 417 (15%) | 4098 (16%) | 11064 (16%) |
10-19 Yrs | 470 (17%) | 3809 (15%) | 11327 (16%) | |
20-29 Yrs | 237 (8%) | 2475 (10%) | 6767 (9%) | |
30-39 Yrs | 391 (14%) | 3644 (14%) | 10245 (14%) | |
40-49 Yrs | 474 (17%) | 3775 (15%) | 10903 (15%) | |
50-59 Yrs | 265 (9%) | 2963 (12%) | 9399 (13%) | |
60-69 Yrs | 229 (8%) | 2126 (8%) | 5254 (7%) | |
70+ Yrs | 196 (7%) | 1542 (6%) | 3401 (4%) | |
Median HH Income | $107,616 | $92,142 | $104,539 | |
Total Household Income | < 24K | 64 (6%) | 719 (8%) | 1268 (5%) |
25-49K | 140 (14%) | 1622 (18%) | 3226 (13%) | |
50-74K | 124 (12%) | 1208 (13%) | 2823 (12%) | |
75-99K | 106 (11%) | 1274 (14%) | 3747 (16%) | |
100-199K | 407 (42%) | 3310 (37%) | 9578 (40%) | |
200K+ | 113 (11%) | 713 (8%) | 2723 (11%) | |
Highest Education Level | No Diploma | 42 | 605 | 1687 |
Diploma or GED | 309 | 3445 | 7798 | |
Some College | 478 | 3641 | 9200 | |
Assoc. Degree | 188 | 1954 | 5768 | |
Bachelors Degree | 449 | 4282 | 13376 | |
Higher Degree | 219 | 1378 | 4876 | |
Total Housing Units | 963 | 9,100 | 23,919 | |
--Owner-Occupied | 845 | 7,121 | 19,906 | |
--Renter-Occupied | 109 | 1,725 | 3,458 | |
Owner-Occupied Values | < 100K | 17 | 340 | 879 |
100-199K | 240 | 1570 | 3663 | |
200-299K | 231 | 2438 | 6555 | |
300-399K | 302 | 1964 | 5440 | |
400-499K | 50 | 577 | 2382 | |
500K+ | 5 | 231 | 988 | |
Total Working Age Population | 1,969 | 17,647 | 49,703 | |
In Work Force | 1,488 | 13,631 | 39,234 | |
Not In Work Force | 481 | 4,016 | 10,469 | |
Workforce Employed | 1,435 | 13,253 | 38,249 | |
Workforce Unemployed | 47 | 357 | 928 | |
Civlian Workforce | 1,482 | 13,610 | 39,177 | |
Military Workforce | 5 | 21 | 57 | |
Total Households | 955 | 8,846 | 23,364 | |
Family Households | 700 | 6,255 | 17,957 | |
Non-Family Households | 255 | 2,591 | 5,408 | |
Married Couple | 598 | 5,050 | 14,997 | |
Other Family | 103 | 1,206 | 2,959 | |
Married w/Child | 321 | 2,692 | 8,308 | |
Single Male w/Child | 34 | 231 | 559 | |
Single Female w/Child | 50 | 667 | 1,434 |
Population Change Last Two Decades - Plus Projection
2000 | % | 2010 | % | 2020 | % | 2030 | |
---|---|---|---|---|---|---|---|
Minnesota | 4,919,479 | +8 | 5,303,925 | +7 | 5,687,161 | +5 | 5,974,304 |
Dakota County | 355,904 | +12 | 398,552 | +9 | 434,203 | +7 | 463,564 |
Scott County | 89,498 | +45 | 129,928 | +18 | 152,927 | +13 | 172,140 |
Total Working Age Population:
Total Households:
Total Working Age Population:
Total Households:
Total Working Age Population:
Total Households: