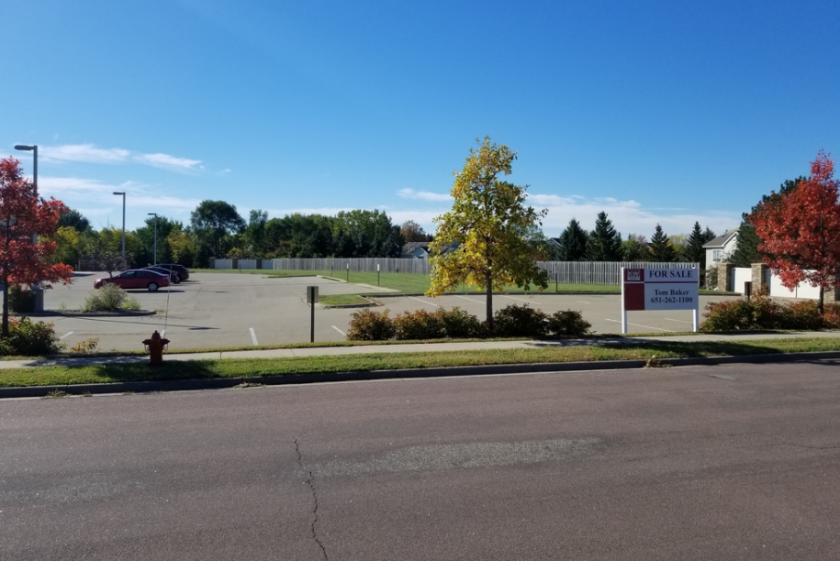
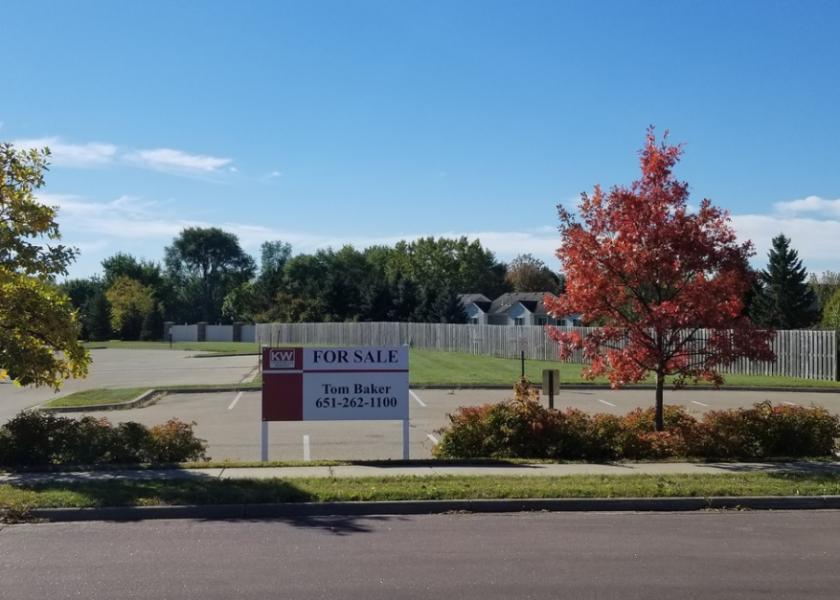
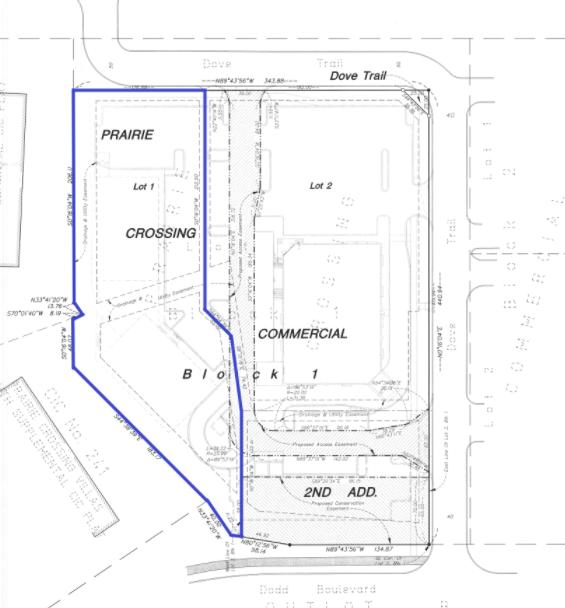
1-Mile | 3-Miles | 5-Miles | ||
---|---|---|---|---|
Total Population | 12,750 | 66,171 | 141,717 | |
Population Median Age | 38 | 36 | 37 | |
Population by Age | 0-9 Yrs | 1754 (13%) | 10036 (15%) | 20334 (14%) |
10-19 Yrs | 1836 (14%) | 9657 (14%) | 20909 (14%) | |
20-29 Yrs | 1097 (8%) | 6854 (10%) | 14568 (10%) | |
30-39 Yrs | 2114 (16%) | 9967 (15%) | 19945 (14%) | |
40-49 Yrs | 1612 (12%) | 9911 (14%) | 20300 (14%) | |
50-59 Yrs | 1853 (14%) | 8997 (13%) | 21228 (14%) | |
60-69 Yrs | 1579 (12%) | 6436 (9%) | 14728 (10%) | |
70+ Yrs | 905 (7%) | 4314 (6%) | 9705 (6%) | |
Median HH Income | $90,677 | $98,363 | $102,994 | |
Total Household Income | < 24K | 306 (6%) | 1796 (7%) | 3376 (6%) |
25-49K | 635 (12%) | 3129 (12%) | 6087 (12%) | |
50-74K | 1003 (20%) | 3577 (14%) | 6881 (13%) | |
75-99K | 830 (16%) | 3872 (15%) | 8150 (16%) | |
100-199K | 1770 (35%) | 9062 (37%) | 19631 (38%) | |
200K+ | 385 (7%) | 2804 (11%) | 6474 (12%) | |
Highest Education Level | No Diploma | 402 | 1699 | 3650 |
Diploma or GED | 1469 | 7158 | 15720 | |
Some College | 1813 | 8480 | 18232 | |
Assoc. Degree | 1172 | 5488 | 11315 | |
Bachelors Degree | 2636 | 13825 | 30640 | |
Higher Degree | 1150 | 6510 | 13641 | |
Total Housing Units | 5,027 | 24,761 | 51,777 | |
--Owner-Occupied | 4,364 | 19,757 | 42,520 | |
--Renter-Occupied | 566 | 4,483 | 8,078 | |
Owner-Occupied Values | < 100K | 71 | 893 | 1879 |
100-199K | 1204 | 4374 | 7886 | |
200-299K | 1896 | 6967 | 14934 | |
300-399K | 746 | 4197 | 10376 | |
400-499K | 302 | 2356 | 5008 | |
500K+ | 143 | 970 | 2437 | |
Total Working Age Population | 9,692 | 49,552 | 107,468 | |
In Work Force | 7,566 | 38,388 | 82,300 | |
Not In Work Force | 2,125 | 11,165 | 25,168 | |
Workforce Employed | 7,330 | 37,487 | 79,793 | |
Workforce Unemployed | 222 | 844 | 2,420 | |
Civlian Workforce | 7,551 | 38,331 | 82,213 | |
Military Workforce | 15 | 57 | 87 | |
Total Households | 4,930 | 24,240 | 50,599 | |
Family Households | 3,514 | 18,110 | 38,648 | |
Non-Family Households | 1,415 | 6,130 | 11,950 | |
Married Couple | 2,816 | 14,742 | 32,346 | |
Other Family | 698 | 3,368 | 6,302 | |
Married w/Child | 1,238 | 7,259 | 15,126 | |
Single Male w/Child | 115 | 598 | 1,223 | |
Single Female w/Child | 308 | 1,509 | 2,740 |
Population Change Last Two Decades - Plus Projection
2000 | % | 2010 | % | 2020 | % | 2030 | |
---|---|---|---|---|---|---|---|
Minnesota | 4,919,479 | +8 | 5,303,925 | +7 | 5,687,161 | +5 | 5,974,304 |
Dakota County | 355,904 | +12 | 398,552 | +9 | 434,203 | +7 | 463,564 |
Hennepin County | 1,116,200 | +3 | 1,152,425 | +12 | 1,294,371 | +9 | 1,407,332 |
Total Working Age Population:
Total Households:
Total Working Age Population:
Total Households:
Total Working Age Population:
Total Households: