Retail Space
55 Depot Street Pine Bush, NY 12566
55 Depot Street Pine Bush, NY 12566

Details & Description
Property Highlights
- • Buy or Lease
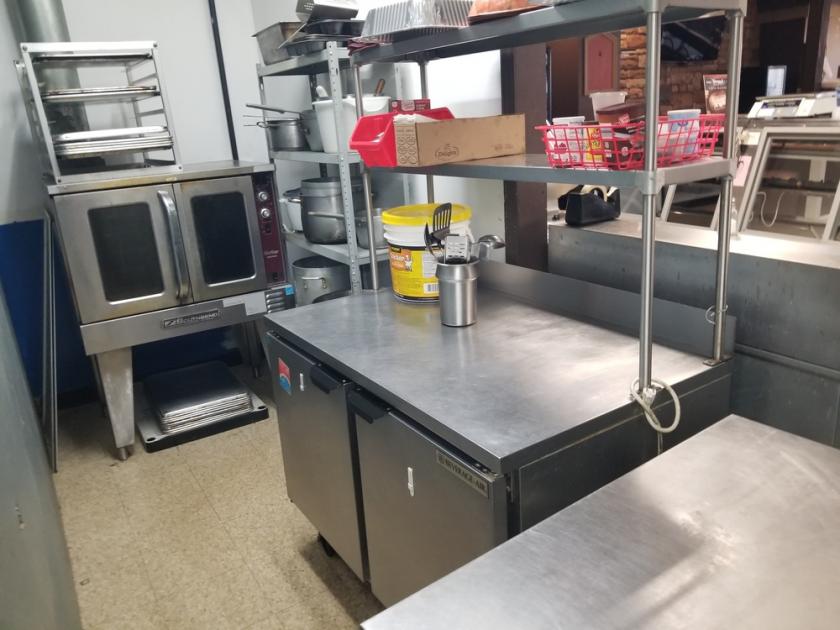
- • Food Service Equipment in Place
- • High Commercial Use
Listing Agents

Robert Donnelly
O: 201-391-2500
M: 914-649-8692
realestatebob61@gmail.com
O: 201-391-2500
M: 914-649-8692
realestatebob61@gmail.com
While we strive to provide the most accurate information, all listing information, and demographic data, is provided by third-parties. As such, MyEListing will not be responsible for the accuracy of the information. It is strongly recommended that you verify all information with the listing agent, and any relevant agencies, prior to making any decisions.