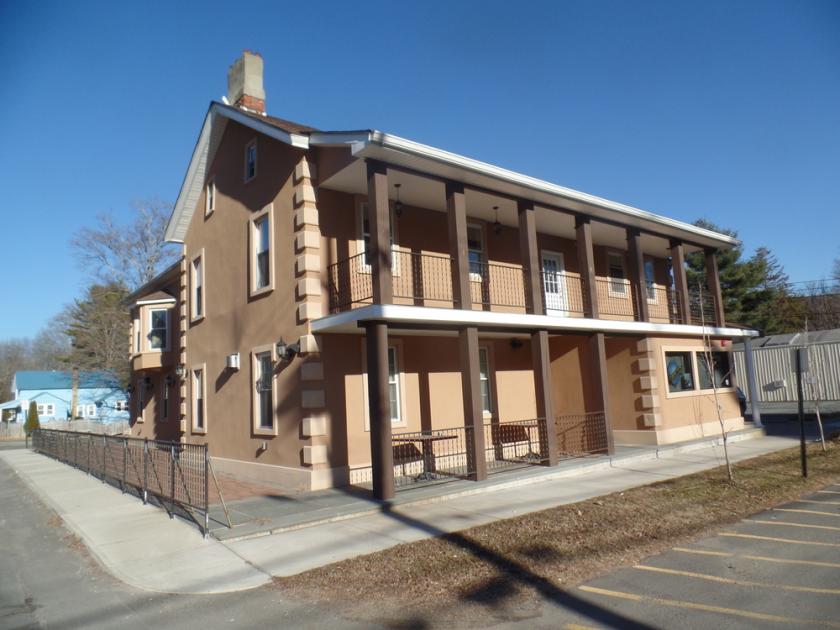
1-Mile | 3-Miles | 5-Miles | ||
---|---|---|---|---|
Total Population | 919 | 4,686 | 11,301 | |
Population Median Age | 42 | 40 | 39 | |
Population by Age | 0-9 Yrs | 75 (8%) | 590 (12%) | 1486 (13%) |
10-19 Yrs | 83 (9%) | 557 (11%) | 1440 (12%) | |
20-29 Yrs | 138 (15%) | 646 (13%) | 1340 (11%) | |
30-39 Yrs | 125 (13%) | 509 (10%) | 1279 (11%) | |
40-49 Yrs | 124 (13%) | 594 (12%) | 1547 (13%) | |
50-59 Yrs | 140 (15%) | 659 (14%) | 1694 (14%) | |
60-69 Yrs | 129 (14%) | 706 (15%) | 1608 (14%) | |
70+ Yrs | 106 (11%) | 425 (9%) | 908 (8%) | |
Median HH Income | $66,867 | $69,648 | $76,728 | |
Total Household Income | < 24K | 59 (15%) | 316 (18%) | 551 (13%) |
25-49K | 74 (19%) | 289 (16%) | 666 (16%) | |
50-74K | 85 (22%) | 350 (20%) | 739 (18%) | |
75-99K | 43 (11%) | 216 (12%) | 529 (13%) | |
100-199K | 96 (25%) | 465 (27%) | 1212 (30%) | |
200K+ | 20 (5%) | 80 (4%) | 288 (7%) | |
Highest Education Level | No Diploma | 49 | 283 | 771 |
Diploma or GED | 245 | 1193 | 2664 | |
Some College | 159 | 721 | 1629 | |
Assoc. Degree | 93 | 310 | 809 | |
Bachelors Degree | 103 | 421 | 1059 | |
Higher Degree | 45 | 244 | 731 | |
Total Housing Units | 460 | 2,391 | 5,435 | |
--Owner-Occupied | 268 | 1,246 | 3,098 | |
--Renter-Occupied | 110 | 471 | 886 | |
Owner-Occupied Values | < 100K | 83 | 367 | 600 |
100-199K | 99 | 298 | 706 | |
200-299K | 54 | 362 | 1030 | |
300-399K | 3 | 103 | 433 | |
400-499K | 17 | 65 | 200 | |
500K+ | 12 | 49 | 129 | |
Total Working Age Population | 809 | 3,773 | 9,017 | |
In Work Force | 542 | 2,422 | 5,873 | |
Not In Work Force | 266 | 1,351 | 3,143 | |
Workforce Employed | 524 | 2,297 | 5,500 | |
Workforce Unemployed | 19 | 122 | 356 | |
Civlian Workforce | 542 | 2,419 | 5,855 | |
Military Workforce | 0 | 3 | 18 | |
Total Households | 378 | 1,716 | 3,984 | |
Family Households | 249 | 1,253 | 2,949 | |
Non-Family Households | 129 | 463 | 1,035 | |
Married Couple | 151 | 932 | 2,322 | |
Other Family | 98 | 321 | 628 | |
Married w/Child | 46 | 416 | 1,059 | |
Single Male w/Child | 9 | 30 | 92 | |
Single Female w/Child | 46 | 125 | 234 |
Population Change Last Two Decades - Plus Projection
2000 | % | 2010 | % | 2020 | % | 2030 | |
---|---|---|---|---|---|---|---|
New York | 18,976,457 | +2 | 19,378,102 | +4 | 20,146,131 | +2 | 20,604,030 |
Orange County | 341,367 | +9 | 372,813 | +3 | 384,125 | +4 | 397,598 |
Sullivan County | 73,966 | +5 | 77,547 | -3 | 74,968 | 0 | 74,720 |
Ulster County | 177,749 | +3 | 182,493 | -2 | 179,009 | -1 | 176,893 |
Total Working Age Population:
Total Households:
Total Working Age Population:
Total Households:
Total Working Age Population:
Total Households: