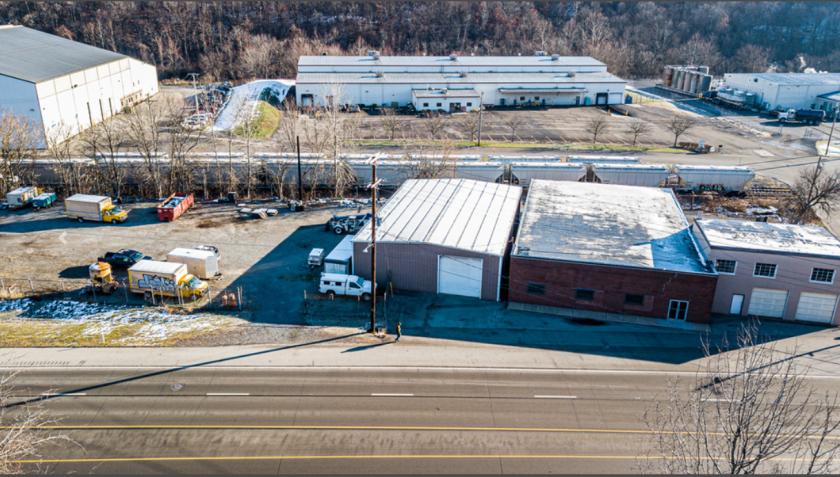
Flex-Office-Warehouse
1102 Sampson Street New Castle, PA 16101
1102 Sampson Street New Castle, PA 16101
Details & Description
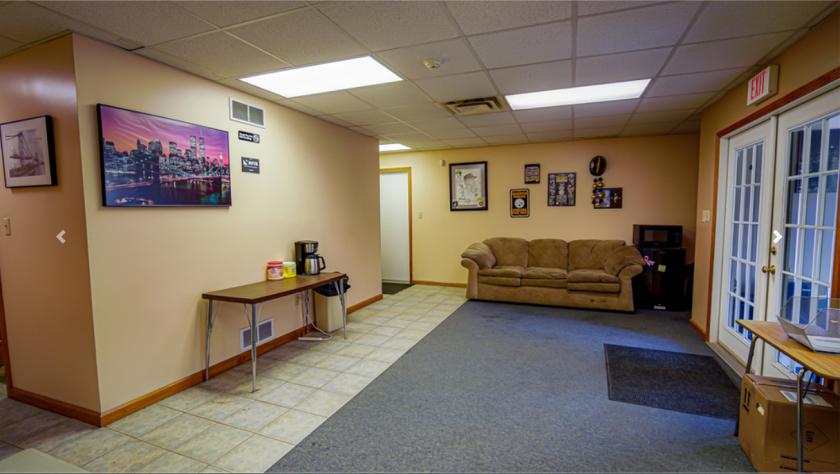
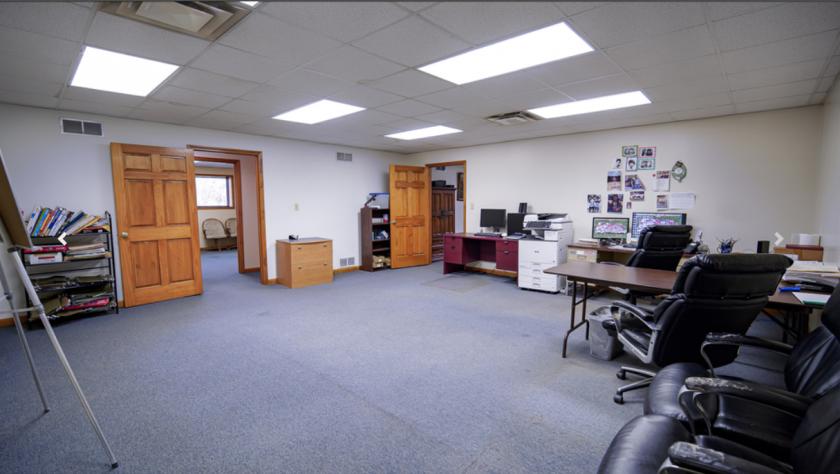
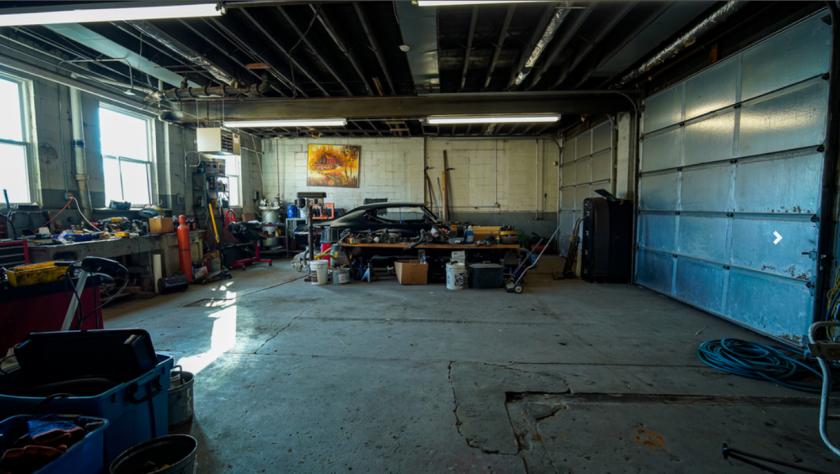
Additional Photos
Listing Agents

Stuart Day
KW Commercial
O: 724-654-0656
M: 412-209-8098
stuartday@kw.com
KW Commercial
O: 724-654-0656
M: 412-209-8098
stuartday@kw.com
While we strive to provide the most accurate information, all listing information, and demographic data, is provided by third-parties. As such, MyEListing will not be responsible for the accuracy of the information. It is strongly recommended that you verify all information with the listing agent, and any relevant agencies, prior to making any decisions.


