Office Space
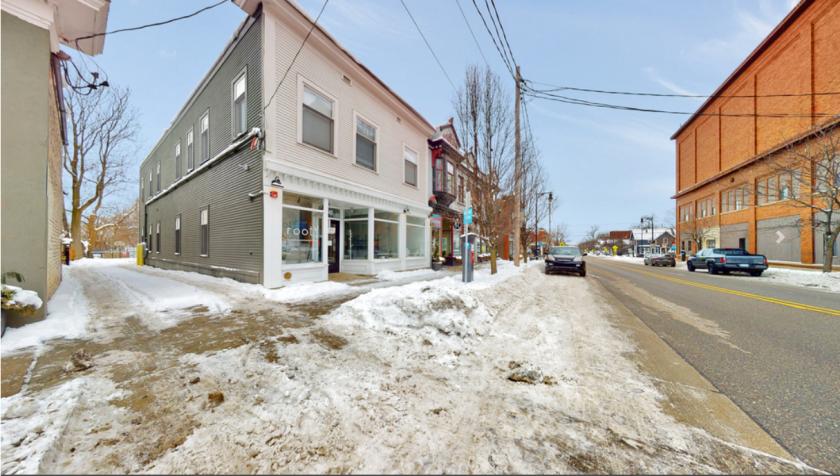
746 Wealthy Street Southeast Grand Rapids, MI 49503
746 Wealthy Street Southeast Grand Rapids, MI 49503
Details & Description
Property Highlights
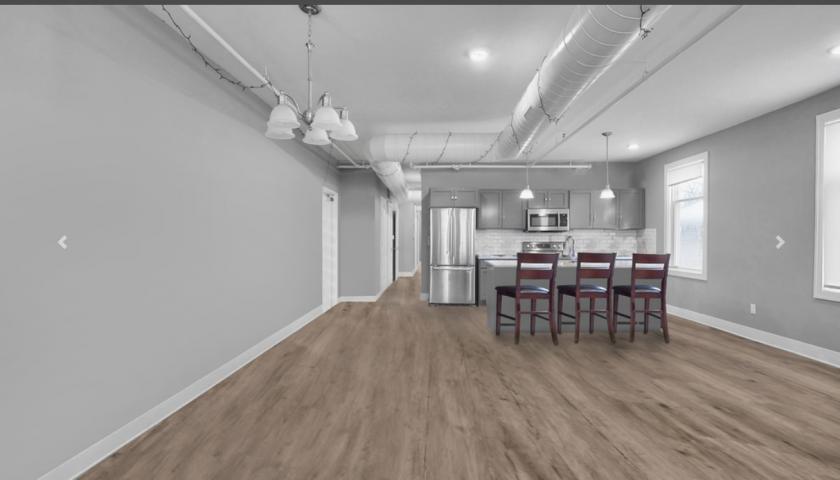
- • 3478 total square footage
- • 12,000 daily traffic count
- • 3 BR 2 BA apartment currently earns $1800mo MTM
- • Current tenants are flexible to stay or vacate
Listing Agents

Jason Carpenter
O: 616-334-2630
M: 616-334-2630
jcarpenter@kw.com
O: 616-334-2630
M: 616-334-2630
jcarpenter@kw.com
While we strive to provide the most accurate information, all listing information, and demographic data, is provided by third-parties. As such, MyEListing will not be responsible for the accuracy of the information. It is strongly recommended that you verify all information with the listing agent, and any relevant agencies, prior to making any decisions.