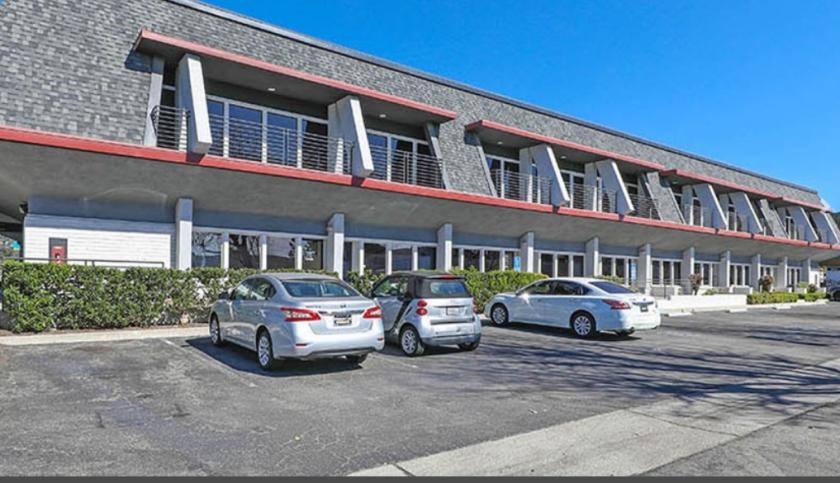
Modern Office Suites in Orange, CA with Dedicated Support Five Days a Week
Furnished and unfurnished offices available
Flexible office sizes 1, 2, 3 or more
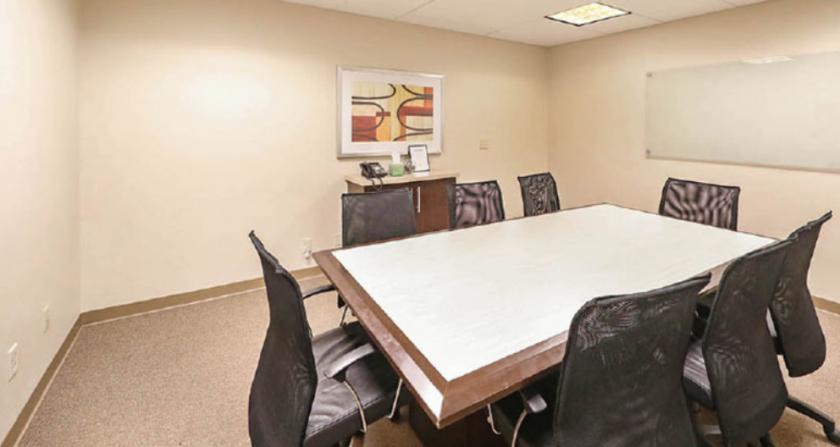
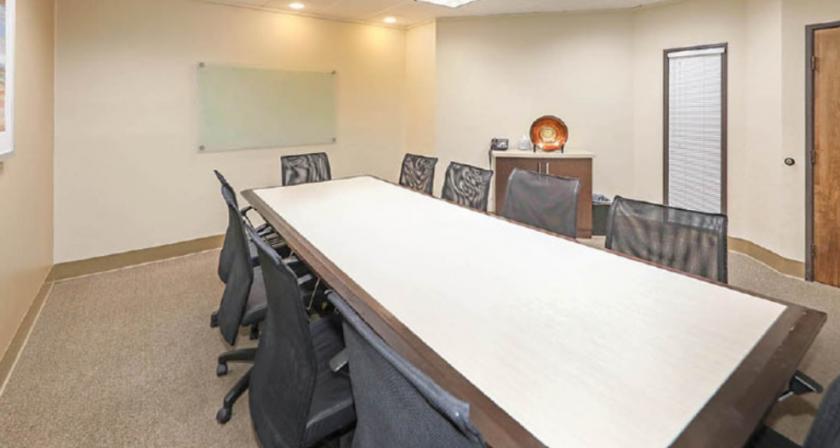
Four separate conference rooms
High-Speed broadband internet
Mail collection and distribution
Professional on site management
Reception and secretarial services
Fully equipped kitchens
No part of this information may be copied, reproduced, repurposed, or screen-captured for any commercial purpose without prior written authorization from MyEListing.
While we strive to provide the most accurate information, all listing information, and demographic data, is provided by third-parties. As such, MyEListing will not be responsible for the accuracy of the information. It is strongly recommended that you verify all information with the listing agent, and any relevant agencies, prior to making any decisions.
What is the asking price for 2230 West Chapman Avenue in Orange?
The asking price for 2230 West Chapman Avenue is $63.33 a SF per Year
What is the building size of this commercial Office property?
The size of this multi-unit property varies between 90 - 186 square feet
What kind of Office is the propery at 2230 West Chapman Avenue?
The property at 2230 West Chapman Avenue Orange, CA 92868 is listed as a Professional Office property
What is the population within 1 mile of 2230 West Chapman Avenue in Orange?
The population within 1 mile of 2230 West Chapman Avenue Orange, CA 92868 is 23,604 people.
Who do I contact for questions about 2230 West Chapman Avenue?
You should contact the listing agent,
Mitchell Blosky, for any details regarding this commercial listing.