Retail Space
275 South Roselle Road Schaumburg, IL 60193
275 South Roselle Road Schaumburg, IL 60193
Details & Description
Property Highlights
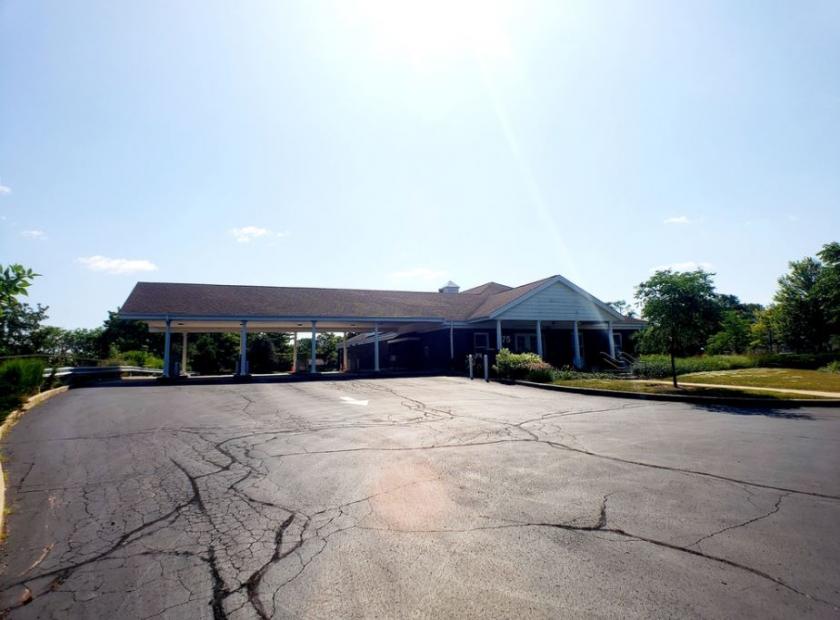
- • Perfectly located in the heart of Schaumburg
- • Ample parking lot providing 55 parking spaces
- • Existing drive-thru
- • Good IngressEgress
- • Great visibility
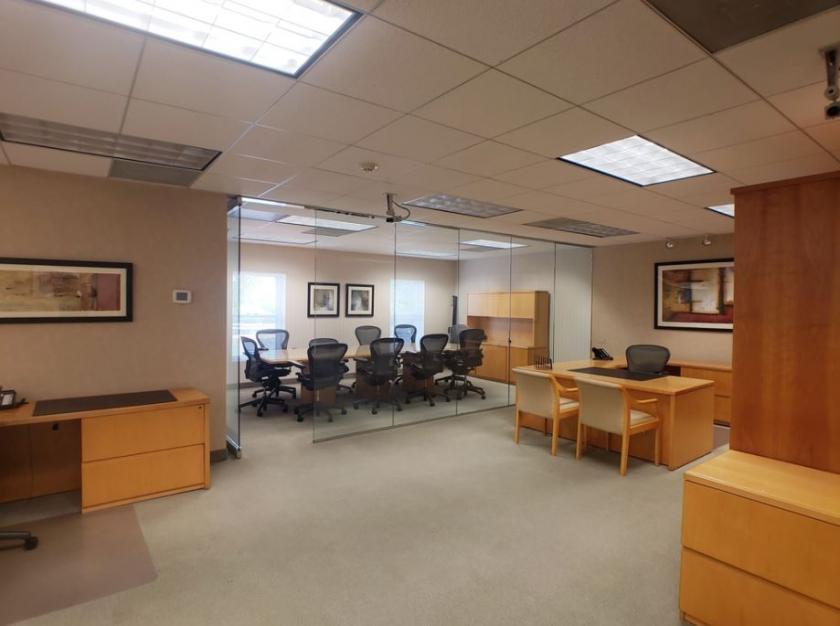
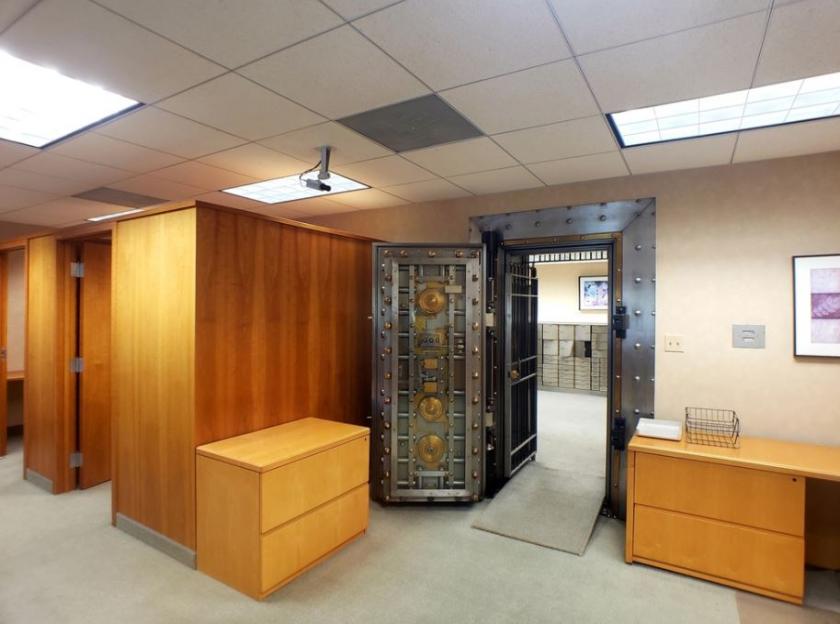
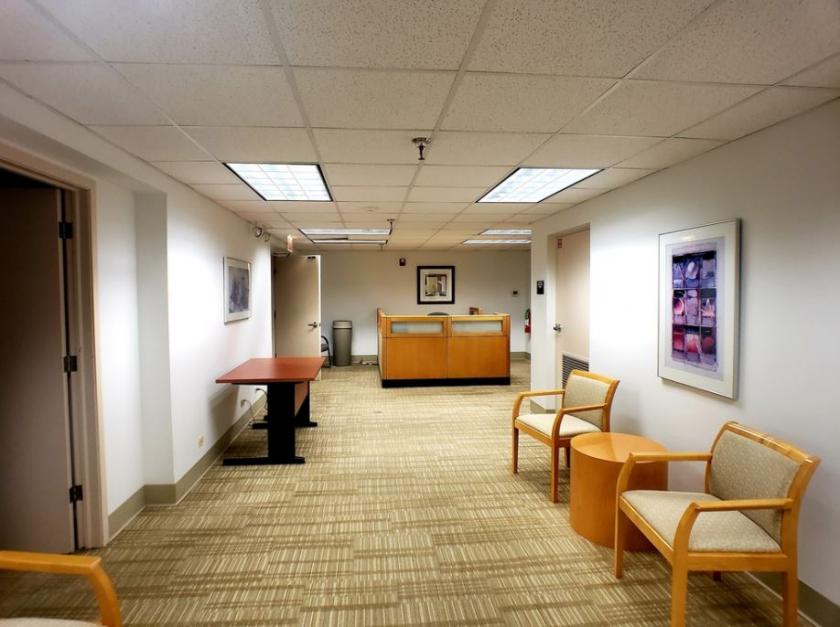
Additional Photos
Listing Agents

Peter Cotsirilos
KW Commercial
O: 630-253-4929
pcotsirilos@kwcommercial.com
KW Commercial
O: 630-253-4929
pcotsirilos@kwcommercial.com
While we strive to provide the most accurate information, all listing information, and demographic data, is provided by third-parties. As such, MyEListing will not be responsible for the accuracy of the information. It is strongly recommended that you verify all information with the listing agent, and any relevant agencies, prior to making any decisions.


