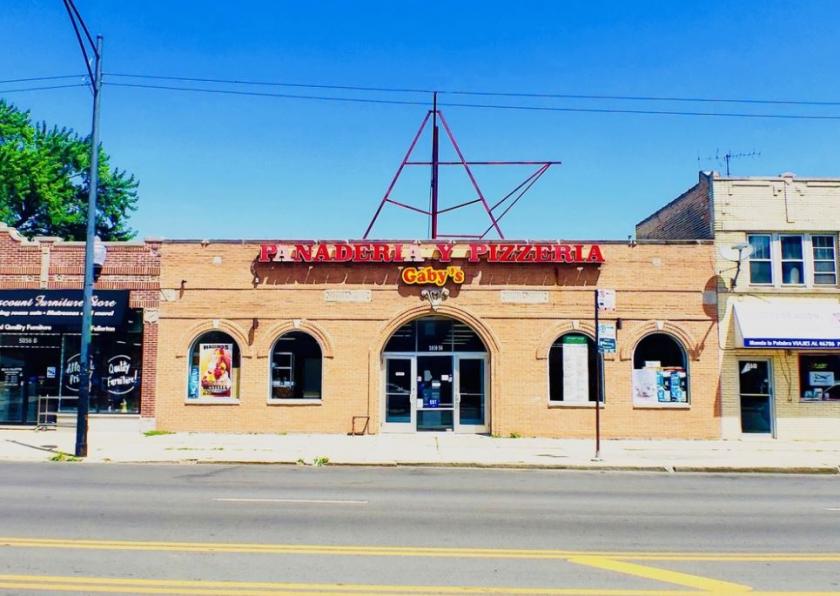
Retail Space
5050 West Fullerton Avenue Chicago, IL 60639
5050 West Fullerton Avenue Chicago, IL 60639
Details & Description
Property Highlights
- • $600,000
- • 4,000 SF Building
- • 6,348 SF Lot
- • 2,280 SF Retail Front Room
- • 23,900 Average Daily Vehicle Count
- • 10 Private Parking Spaces
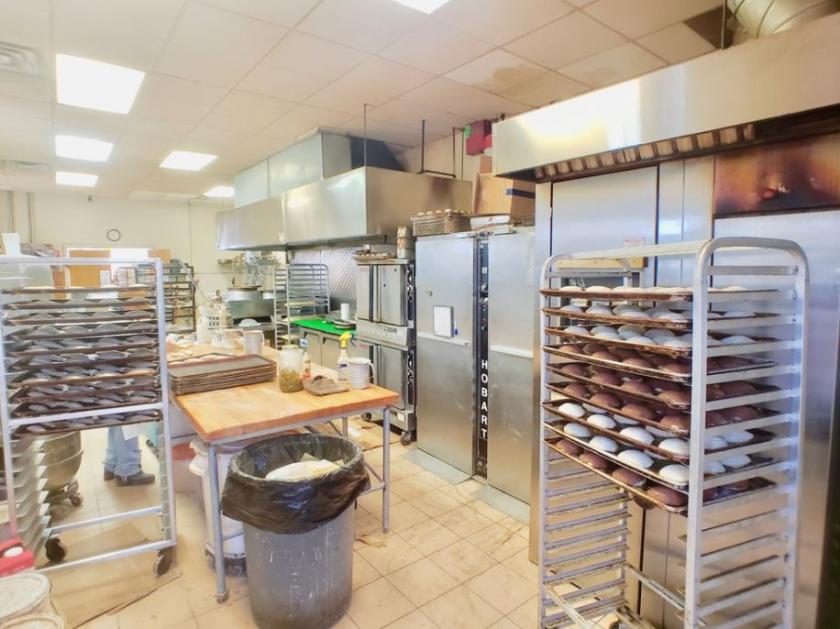
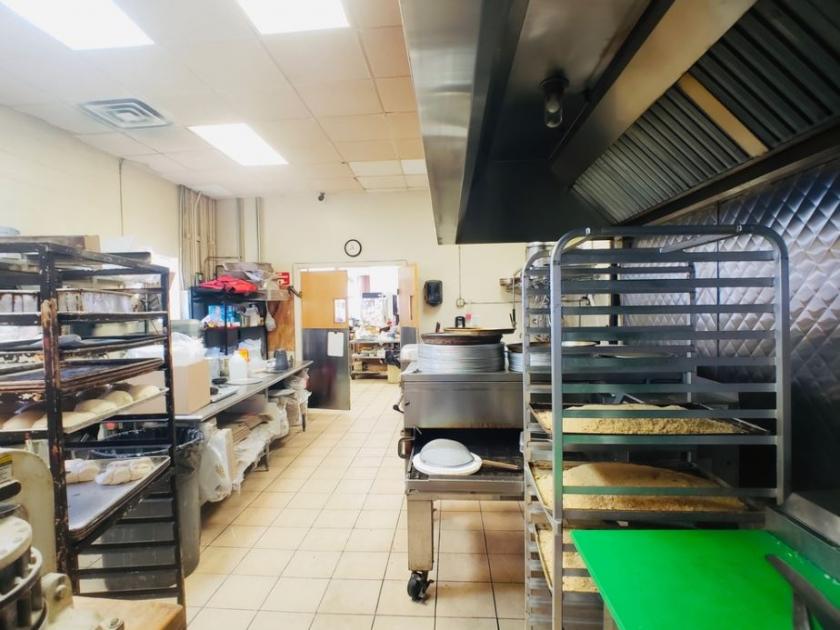
Additional Photos

Listing Agents

Peter Cotsirilos
KW Commercial
O: 630-253-4929
pcotsirilos@kwcommercial.com
KW Commercial
O: 630-253-4929
pcotsirilos@kwcommercial.com
While we strive to provide the most accurate information, all listing information, and demographic data, is provided by third-parties. As such, MyEListing will not be responsible for the accuracy of the information. It is strongly recommended that you verify all information with the listing agent, and any relevant agencies, prior to making any decisions.


