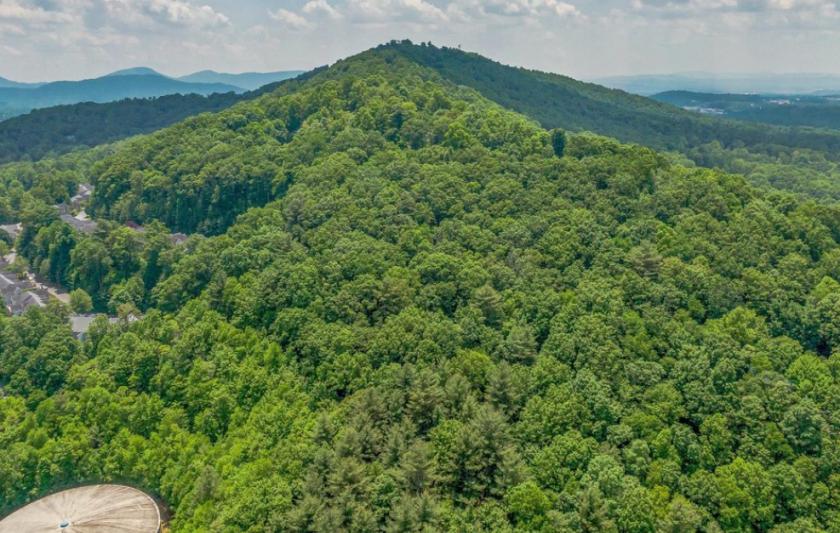
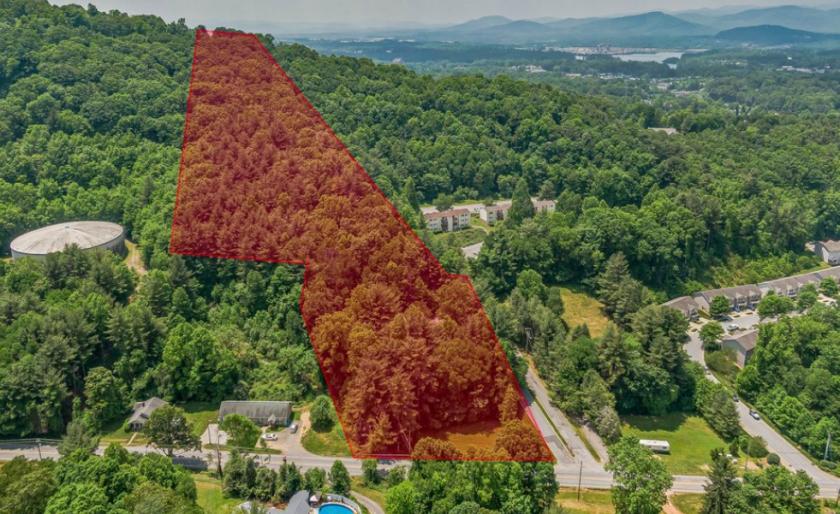
1-Mile | 3-Miles | 5-Miles | ||
---|---|---|---|---|
Total Population | 4,743 | 26,780 | 57,313 | |
Population Median Age | 45 | 43 | 42 | |
Population by Age | 0-9 Yrs | 411 (8%) | 2605 (9%) | 5852 (10%) |
10-19 Yrs | 338 (7%) | 2647 (9%) | 6226 (10%) | |
20-29 Yrs | 816 (17%) | 3103 (11%) | 6758 (11%) | |
30-39 Yrs | 491 (10%) | 3473 (12%) | 7260 (12%) | |
40-49 Yrs | 696 (14%) | 3835 (14%) | 8636 (15%) | |
50-59 Yrs | 457 (9%) | 3268 (12%) | 7137 (12%) | |
60-69 Yrs | 567 (11%) | 3645 (13%) | 7448 (12%) | |
70+ Yrs | 966 (20%) | 4203 (15%) | 7997 (13%) | |
Median HH Income | $53,135 | $58,904 | $57,584 | |
Total Household Income | < 24K | 343 (14%) | 1761 (14%) | 4035 (16%) |
25-49K | 736 (31%) | 3315 (27%) | 6788 (27%) | |
50-74K | 548 (23%) | 2413 (20%) | 4710 (19%) | |
75-99K | 226 (9%) | 1375 (11%) | 3131 (12%) | |
100-199K | 413 (17%) | 2344 (19%) | 4630 (18%) | |
200K+ | 76 (3%) | 728 (6%) | 1477 (5%) | |
Highest Education Level | No Diploma | 43 | 1150 | 2953 |
Diploma or GED | 566 | 3689 | 8799 | |
Some College | 742 | 3452 | 7789 | |
Assoc. Degree | 365 | 2002 | 4083 | |
Bachelors Degree | 1122 | 5941 | 11741 | |
Higher Degree | 697 | 3732 | 6695 | |
Total Housing Units | 2,554 | 13,866 | 28,293 | |
--Owner-Occupied | 1,149 | 6,208 | 14,543 | |
--Renter-Occupied | 1,192 | 5,728 | 10,228 | |
Owner-Occupied Values | < 100K | 49 | 389 | 1320 |
100-199K | 399 | 1713 | 3985 | |
200-299K | 169 | 1441 | 3918 | |
300-399K | 206 | 996 | 2188 | |
400-499K | 129 | 432 | 760 | |
500K+ | 196 | 1238 | 2374 | |
Total Working Age Population | 4,094 | 22,401 | 47,323 | |
In Work Force | 2,509 | 13,880 | 29,951 | |
Not In Work Force | 1,585 | 8,521 | 17,373 | |
Workforce Employed | 2,483 | 13,703 | 29,307 | |
Workforce Unemployed | 26 | 176 | 644 | |
Civlian Workforce | 2,509 | 13,880 | 29,951 | |
Military Workforce | 0 | 0 | 0 | |
Total Households | 2,341 | 11,936 | 24,771 | |
Family Households | 1,025 | 6,396 | 13,875 | |
Non-Family Households | 1,316 | 5,540 | 10,896 | |
Married Couple | 787 | 5,096 | 11,263 | |
Other Family | 239 | 1,300 | 2,612 | |
Married w/Child | 332 | 1,860 | 4,189 | |
Single Male w/Child | 21 | 119 | 239 | |
Single Female w/Child | 95 | 494 | 953 |
Population Change Last Two Decades - Plus Projection
2000 | % | 2010 | % | 2020 | % | 2030 | |
---|---|---|---|---|---|---|---|
North Carolina | 8,049,313 | +18 | 9,535,483 | +11 | 10,630,691 | +11 | 11,836,070 |
Buncombe County | 206,330 | +16 | 238,318 | +12 | 267,046 | +11 | 296,961 |
Henderson County | 89,173 | +20 | 106,740 | +12 | 119,730 | +10 | 132,035 |
Total Working Age Population:
Total Households:
Total Working Age Population:
Total Households:
Total Working Age Population:
Total Households: