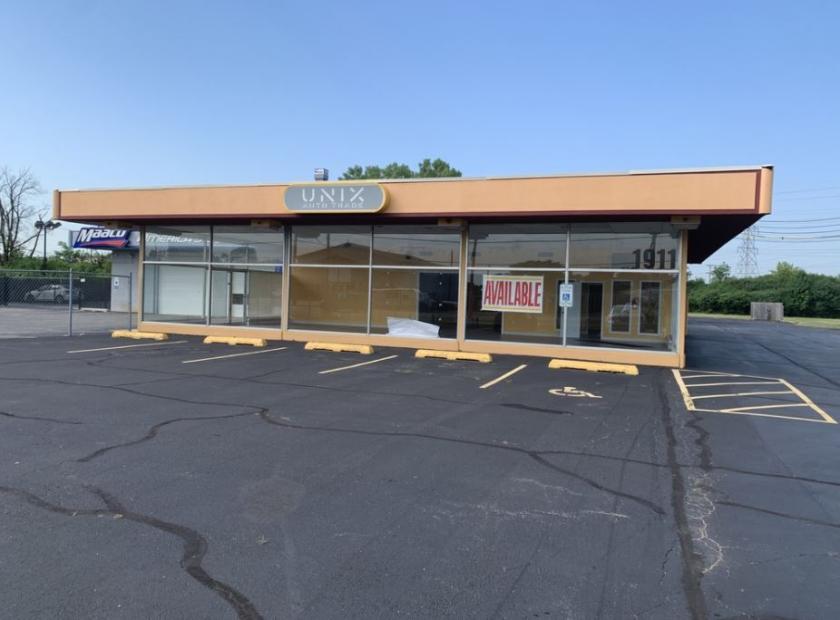
Retail Space
1911 Plainfield Road Crest Hill, IL 60403
1911 Plainfield Road Crest Hill, IL 60403
Details & Description
Property Highlights
- • Great Visibility
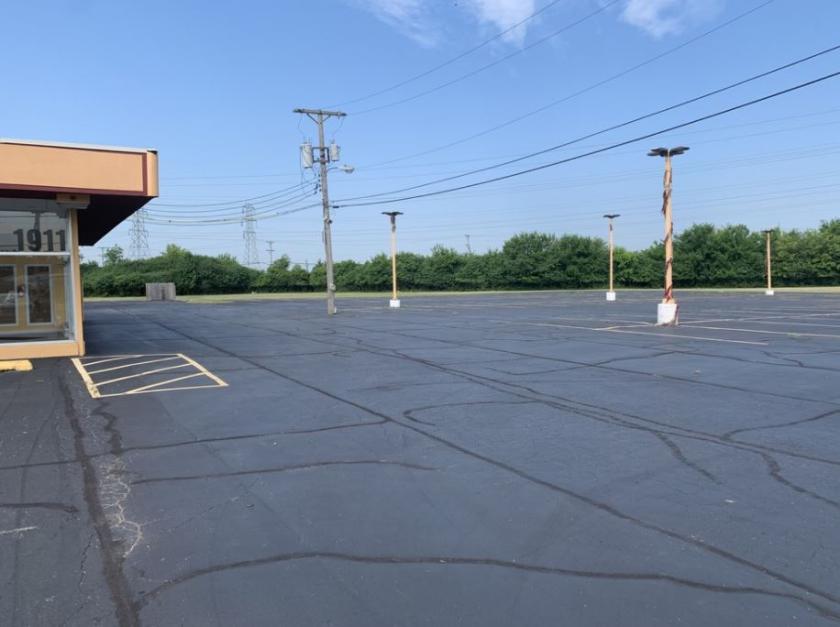
- • Fantastic IngressEgress
- • Growing Area
- • Close to New Developments
- • Newer Roof
- • Newer HVAC Units
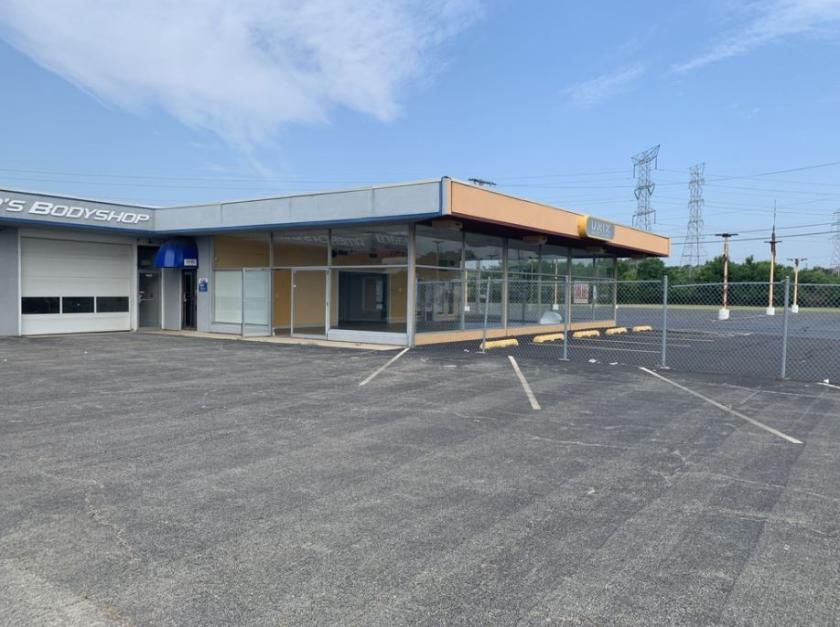
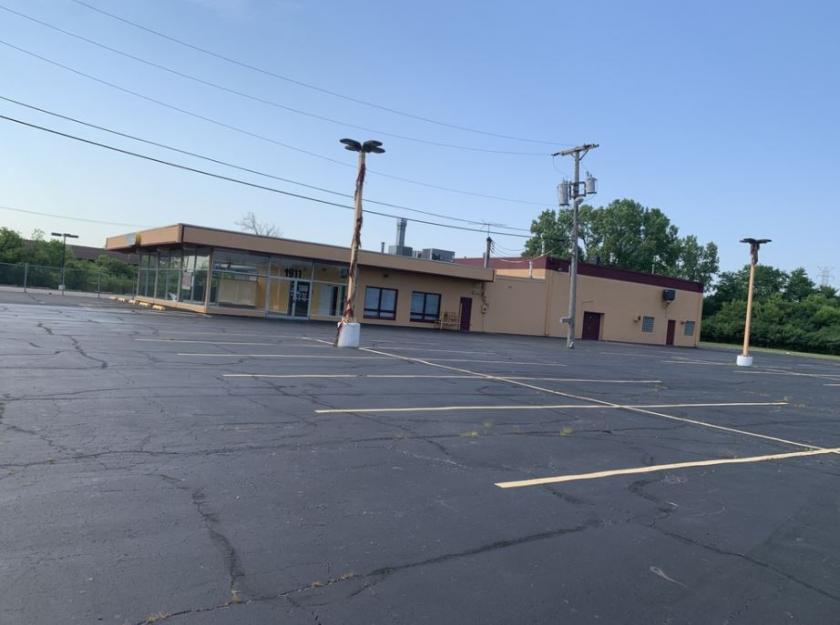
Additional Photos
Listing Agents

Peter Cotsirilos
KW Commercial
O: 630-253-4929
pcotsirilos@kwcommercial.com
KW Commercial
O: 630-253-4929
pcotsirilos@kwcommercial.com
While we strive to provide the most accurate information, all listing information, and demographic data, is provided by third-parties. As such, MyEListing will not be responsible for the accuracy of the information. It is strongly recommended that you verify all information with the listing agent, and any relevant agencies, prior to making any decisions.


