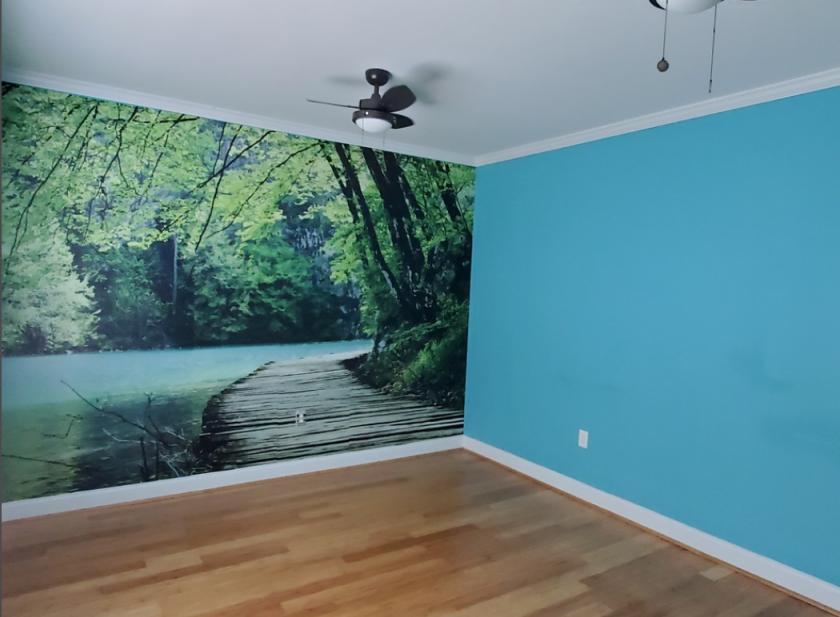
Office Space
110 Samaritan Drive Cumming, GA 30040
110 Samaritan Drive Cumming, GA 30040
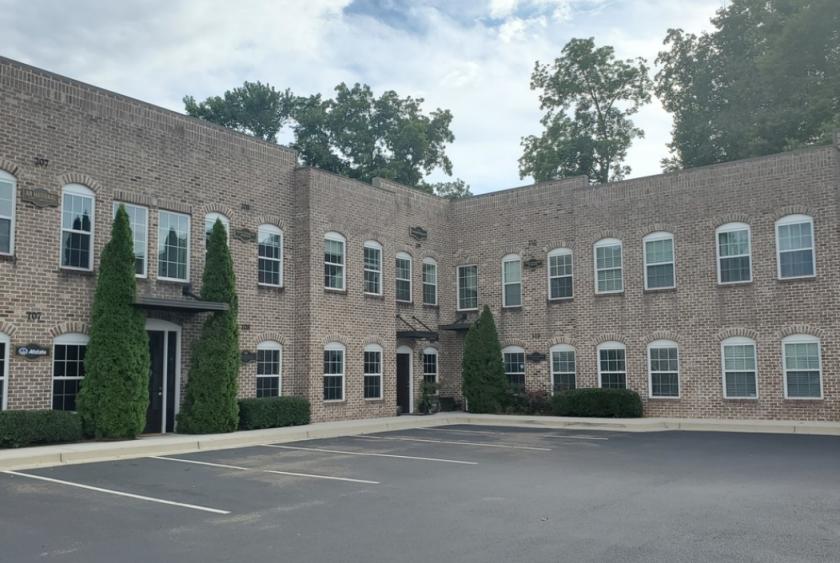
Details & Description
Property Highlights
• Wont Last Office condos are in high demand by investors and ownerusers
• Can be combined with Suite 209 for a total of 2,310 square feet
Listing Agents

JB Bader
O: 770-205-2600
M: 678-858-4582
jbbader@kwcommercial.com
O: 770-205-2600
M: 678-858-4582
jbbader@kwcommercial.com
While we strive to provide the most accurate information, all listing information, and demographic data, is provided by third-parties. As such, MyEListing will not be responsible for the accuracy of the information. It is strongly recommended that you verify all information with the listing agent, and any relevant agencies, prior to making any decisions.