Commercial Land
1467 US-441 Clayton, GA 30525
1467 US-441 Clayton, GA 30525
Details & Description
Property Highlights
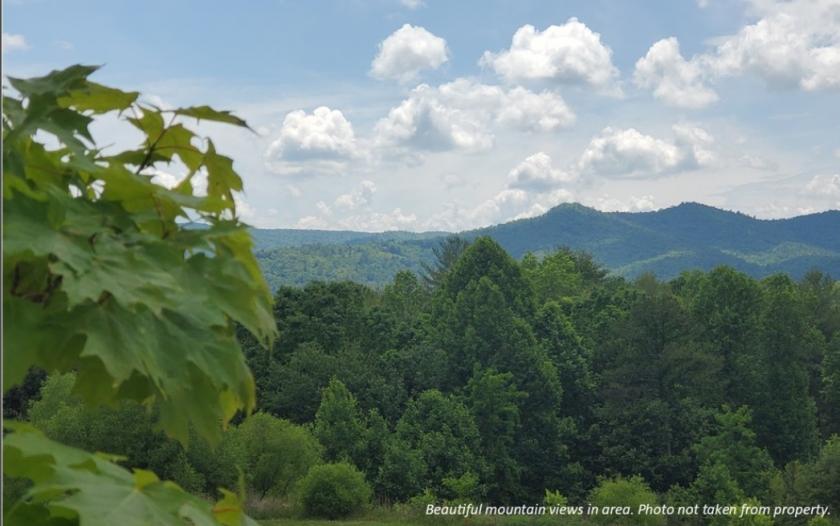
- • Beautiful Blue Ridge Mountain Property
- • 35 miles from Highland, NC
- • Smaller streams also on property
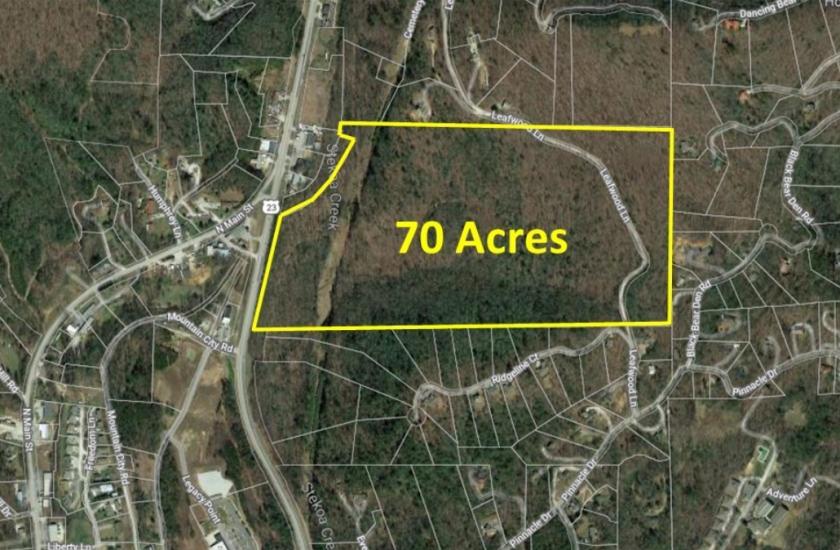
- • Rabun County, Georgia 10 miles from Tallulah Falls
- • 6 miles to Lake Burton
Listing Agents

JB Bader
O: 770-205-2600
M: 678-858-4582
jbbader@kwcommercial.com
O: 770-205-2600
M: 678-858-4582
jbbader@kwcommercial.com
While we strive to provide the most accurate information, all listing information, and demographic data, is provided by third-parties. As such, MyEListing will not be responsible for the accuracy of the information. It is strongly recommended that you verify all information with the listing agent, and any relevant agencies, prior to making any decisions.