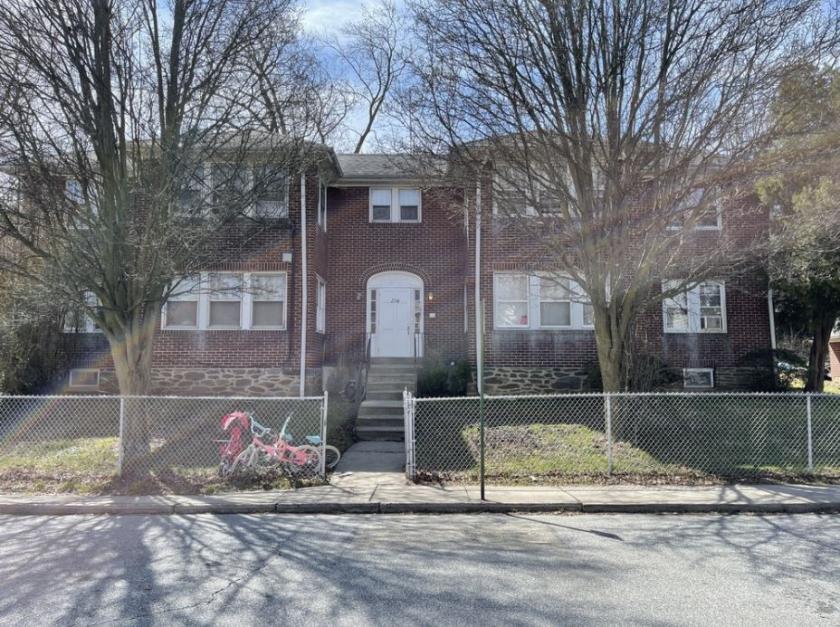
Multifamily Housing
234 Reese Street Sharon Hill, PA 19079
234 Reese Street Sharon Hill, PA 19079
Details & Description
Property Highlights
- • Four spacious 2 bedroom 1 bath units
- • Four garages with electric for additional income
- • Separate Utilities
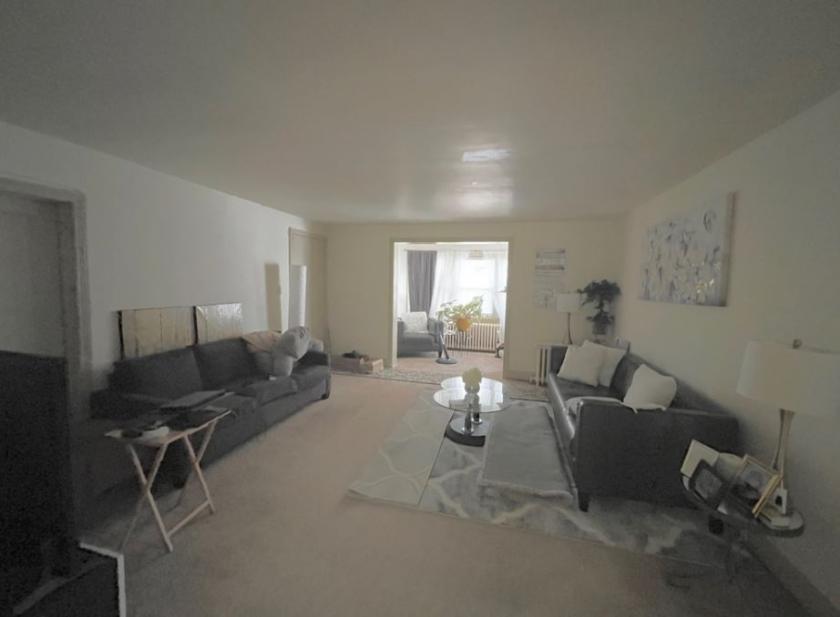
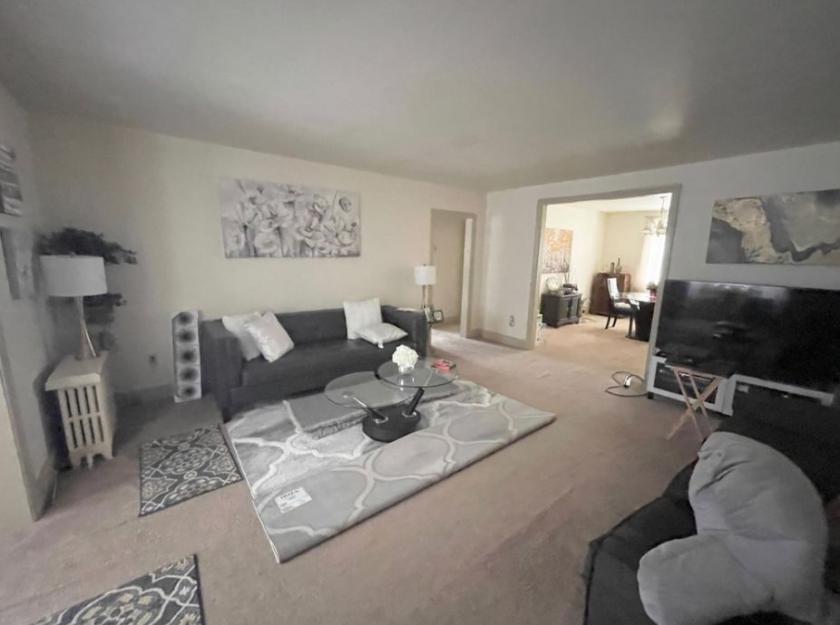
Additional Photos

Listing Agents

Brady Carroll
KW Commercial
O: 610-291-9895
bcarroll@kwcommercial.com
KW Commercial
O: 610-291-9895
bcarroll@kwcommercial.com
While we strive to provide the most accurate information, all listing information, and demographic data, is provided by third-parties. As such, MyEListing will not be responsible for the accuracy of the information. It is strongly recommended that you verify all information with the listing agent, and any relevant agencies, prior to making any decisions.


