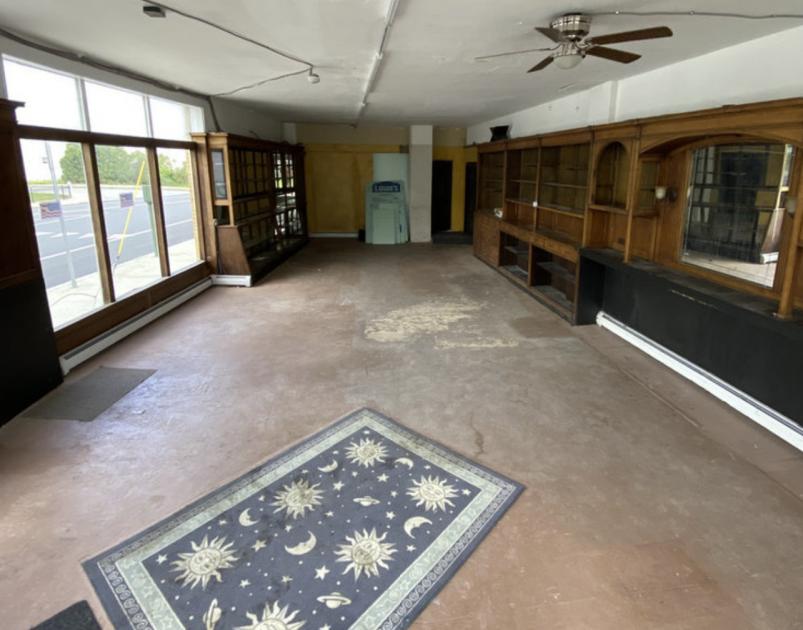
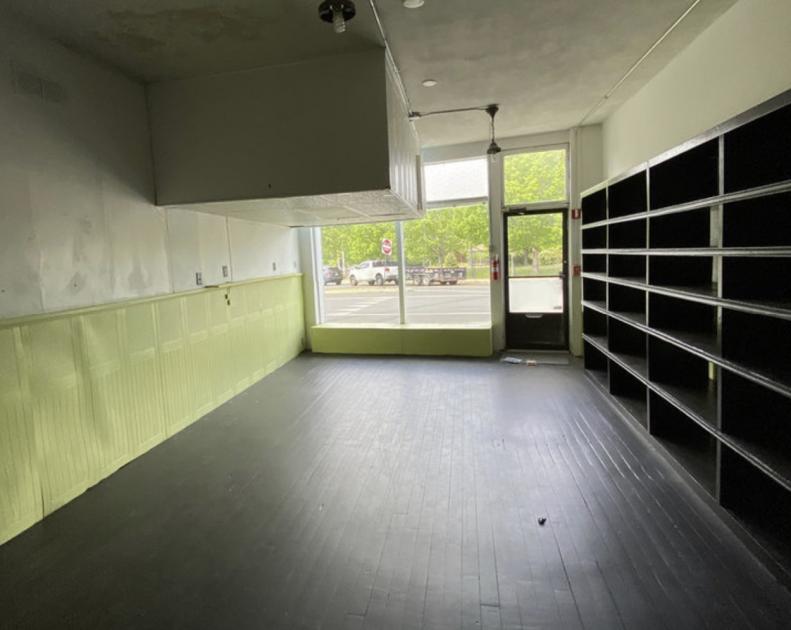
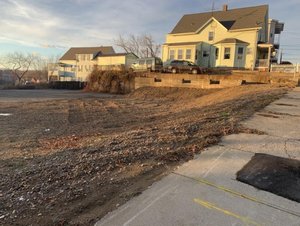
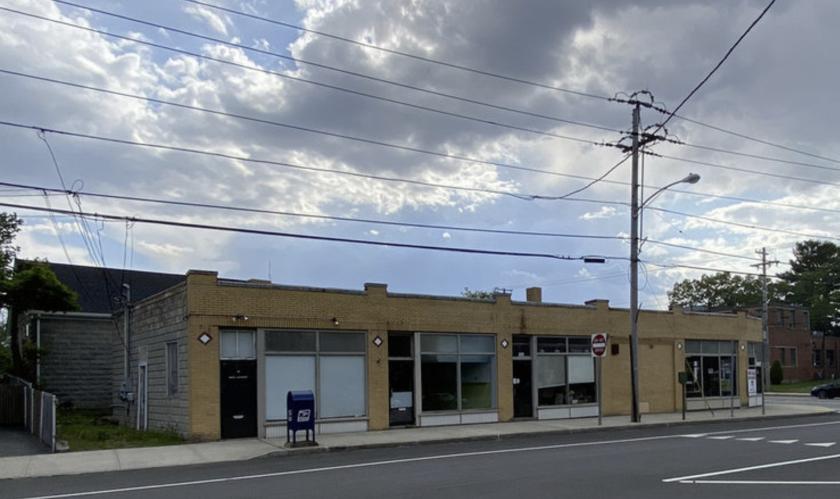
1-Mile | 3-Miles | 5-Miles | ||
---|---|---|---|---|
Total Population | 8,782 | 112,251 | 341,626 | |
Population Median Age | 44 | 39 | 37 | |
Population by Age | 0-9 Yrs | 971 (11%) | 10919 (9%) | 38335 (11%) |
10-19 Yrs | 765 (8%) | 13637 (12%) | 46593 (13%) | |
20-29 Yrs | 812 (9%) | 20459 (18%) | 60986 (17%) | |
30-39 Yrs | 1297 (14%) | 15990 (14%) | 48447 (14%) | |
40-49 Yrs | 1087 (12%) | 12566 (11%) | 38972 (11%) | |
50-59 Yrs | 1351 (15%) | 14141 (12%) | 42017 (12%) | |
60-69 Yrs | 1150 (13%) | 12311 (10%) | 34928 (10%) | |
70+ Yrs | 1348 (15%) | 12228 (10%) | 31349 (9%) | |
Median HH Income | $71,500 | $61,550 | $51,994 | |
Total Household Income | < 24K | 723 (18%) | 10196 (22%) | 34739 (27%) |
25-49K | 688 (18%) | 8518 (19%) | 27286 (21%) | |
50-74K | 570 (14%) | 7661 (17%) | 21497 (16%) | |
75-99K | 516 (13%) | 5305 (11%) | 15249 (11%) | |
100-199K | 1011 (26%) | 9142 (20%) | 22283 (17%) | |
200K+ | 300 (7%) | 3930 (8%) | 6705 (5%) | |
Highest Education Level | No Diploma | 889 | 10338 | 37914 |
Diploma or GED | 1482 | 17462 | 66627 | |
Some College | 1078 | 11907 | 38559 | |
Assoc. Degree | 414 | 5446 | 15872 | |
Bachelors Degree | 1818 | 16719 | 38547 | |
Higher Degree | 1072 | 15753 | 28757 | |
Total Housing Units | 3,927 | 49,718 | 145,684 | |
--Owner-Occupied | 2,538 | 23,215 | 58,456 | |
--Renter-Occupied | 1,272 | 21,537 | 69,303 | |
Owner-Occupied Values | < 100K | 77 | 1002 | 3263 |
100-199K | 555 | 5916 | 20427 | |
200-299K | 1114 | 7715 | 19110 | |
300-399K | 434 | 3704 | 7809 | |
400-499K | 238 | 1605 | 3132 | |
500K+ | 118 | 3274 | 4714 | |
Total Working Age Population | 7,297 | 94,506 | 278,627 | |
In Work Force | 4,876 | 62,006 | 178,160 | |
Not In Work Force | 2,420 | 32,500 | 100,467 | |
Workforce Employed | 4,746 | 58,622 | 166,858 | |
Workforce Unemployed | 130 | 3,290 | 11,123 | |
Civlian Workforce | 4,876 | 61,911 | 177,980 | |
Military Workforce | 0 | 95 | 180 | |
Total Households | 3,810 | 44,752 | 127,759 | |
Family Households | 2,130 | 24,719 | 74,358 | |
Non-Family Households | 1,680 | 20,033 | 53,401 | |
Married Couple | 1,705 | 17,267 | 45,705 | |
Other Family | 425 | 7,452 | 28,652 | |
Married w/Child | 650 | 6,424 | 18,946 | |
Single Male w/Child | 55 | 883 | 3,142 | |
Single Female w/Child | 92 | 3,152 | 12,410 |
Population Change Last Two Decades - Plus Projection
2000 | % | 2010 | % | 2020 | % | 2030 | |
---|---|---|---|---|---|---|---|
Massachusetts | 6,349,097 | +3 | 6,547,629 | +6 | 6,933,887 | +4 | 7,225,472 |
Bristol County | 534,678 | +3 | 548,285 | +2 | 561,478 | +1 | 567,277 |
Rhode Island | 1,048,319 | 0 | 1,052,567 | 0 | 1,049,177 | +2 | 1,070,677 |
Bristol County | 50,648 | -2 | 49,875 | -2 | 48,957 | 0 | 49,192 |
Kent County | 167,090 | -1 | 166,158 | -1 | 164,452 | +1 | 166,619 |
Providence County | 621,602 | +1 | 626,667 | 0 | 627,214 | +2 | 639,847 |
Total Working Age Population:
Total Households:
Total Working Age Population:
Total Households:
Total Working Age Population:
Total Households: