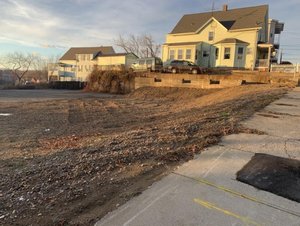
1-Mile | 3-Miles | 5-Miles | ||
---|---|---|---|---|
Total Population | 31,648 | 138,307 | 273,726 | |
Population Median Age | 38 | 39 | 38 | |
Population by Age | 0-9 Yrs | 3771 (11%) | 16415 (11%) | 29525 (10%) |
10-19 Yrs | 3567 (11%) | 15924 (11%) | 35549 (12%) | |
20-29 Yrs | 5057 (15%) | 20455 (14%) | 45516 (16%) | |
30-39 Yrs | 5099 (16%) | 19769 (14%) | 37681 (13%) | |
40-49 Yrs | 3864 (12%) | 17956 (12%) | 32941 (12%) | |
50-59 Yrs | 4394 (13%) | 19357 (13%) | 36219 (13%) | |
60-69 Yrs | 3231 (10%) | 15840 (11%) | 29542 (10%) | |
70+ Yrs | 2664 (8%) | 12591 (9%) | 26753 (9%) | |
Median HH Income | $42,935 | $54,206 | $58,420 | |
Total Household Income | < 24K | 4119 (32%) | 12916 (24%) | 24707 (23%) |
25-49K | 3051 (23%) | 12122 (22%) | 21419 (20%) | |
50-74K | 2441 (19%) | 9249 (17%) | 16621 (15%) | |
75-99K | 1440 (11%) | 6623 (12%) | 12580 (12%) | |
100-199K | 1432 (11%) | 9939 (18%) | 21732 (20%) | |
200K+ | 289 (2%) | 2399 (4%) | 7042 (6%) | |
Highest Education Level | No Diploma | 4431 | 17679 | 26923 |
Diploma or GED | 7701 | 30633 | 52587 | |
Some College | 3988 | 17047 | 31594 | |
Assoc. Degree | 1889 | 7729 | 13733 | |
Bachelors Degree | 2681 | 14913 | 35412 | |
Higher Degree | 1309 | 8841 | 25916 | |
Total Housing Units | 14,267 | 59,011 | 116,916 | |
--Owner-Occupied | 4,021 | 27,133 | 54,765 | |
--Renter-Occupied | 8,751 | 26,115 | 49,335 | |
Owner-Occupied Values | < 100K | 336 | 1633 | 2788 |
100-199K | 1984 | 10024 | 16161 | |
200-299K | 1386 | 9431 | 18129 | |
300-399K | 219 | 3344 | 9092 | |
400-499K | 24 | 1195 | 3648 | |
500K+ | 71 | 1506 | 4948 | |
Total Working Age Population | 25,743 | 112,133 | 225,699 | |
In Work Force | 17,174 | 75,195 | 146,926 | |
Not In Work Force | 8,568 | 36,937 | 78,774 | |
Workforce Employed | 15,763 | 70,331 | 138,386 | |
Workforce Unemployed | 1,356 | 4,720 | 8,357 | |
Civlian Workforce | 17,119 | 75,052 | 146,743 | |
Military Workforce | 55 | 144 | 182 | |
Total Households | 12,772 | 53,248 | 104,101 | |
Family Households | 7,105 | 33,577 | 61,918 | |
Non-Family Households | 5,666 | 19,671 | 42,183 | |
Married Couple | 3,617 | 21,305 | 41,037 | |
Other Family | 3,488 | 12,272 | 20,881 | |
Married w/Child | 1,456 | 8,424 | 16,688 | |
Single Male w/Child | 459 | 1,507 | 2,341 | |
Single Female w/Child | 1,445 | 5,009 | 8,610 |
Population Change Last Two Decades - Plus Projection
2000 | % | 2010 | % | 2020 | % | 2030 | |
---|---|---|---|---|---|---|---|
Massachusetts | 6,349,097 | +3 | 6,547,629 | +6 | 6,933,887 | +4 | 7,225,472 |
Bristol County | 534,678 | +3 | 548,285 | +2 | 561,478 | +1 | 567,277 |
Rhode Island | 1,048,319 | 0 | 1,052,567 | 0 | 1,049,177 | +2 | 1,070,677 |
Providence County | 621,602 | +1 | 626,667 | 0 | 627,214 | +2 | 639,847 |
Total Working Age Population:
Total Households:
Total Working Age Population:
Total Households:
Total Working Age Population:
Total Households: