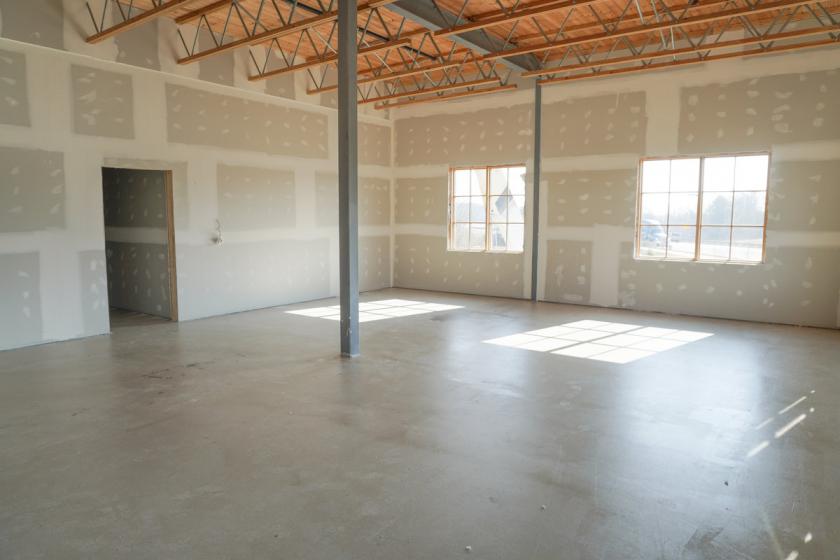
Office Space
50 Crahen Avenue Northeast Grand Rapids, MI 49525
50 Crahen Avenue Northeast Grand Rapids, MI 49525
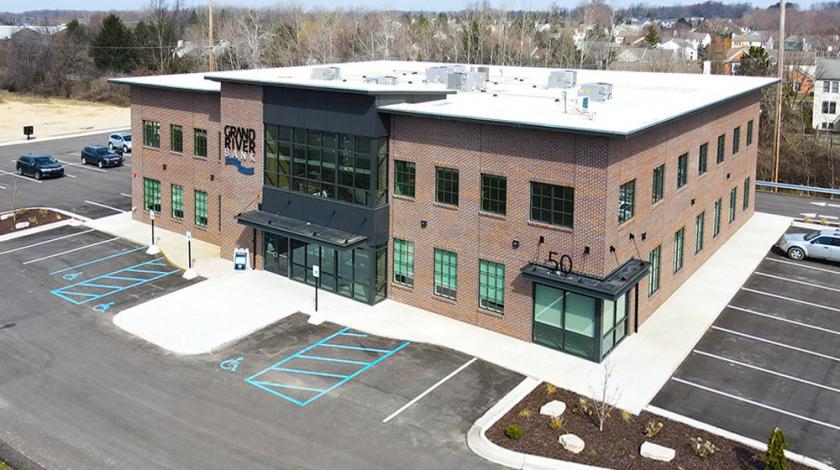
Details & Description
Property Highlights
• HIGHLY VISIBLE CLASS A OFFICE SPACE AVAILABLE
• HIGHLY VISIBLE CLASS A OFFICE SPACE AVAILABLE
Listing Agents

Blake Rosekrans
O: 616-726-5476
M: 616-690-3283
blake.rosekrans@martincommercial.com
O: 616-726-5476
M: 616-690-3283
blake.rosekrans@martincommercial.com
While we strive to provide the most accurate information, all listing information, and demographic data, is provided by third-parties. As such, MyEListing will not be responsible for the accuracy of the information. It is strongly recommended that you verify all information with the listing agent, and any relevant agencies, prior to making any decisions.