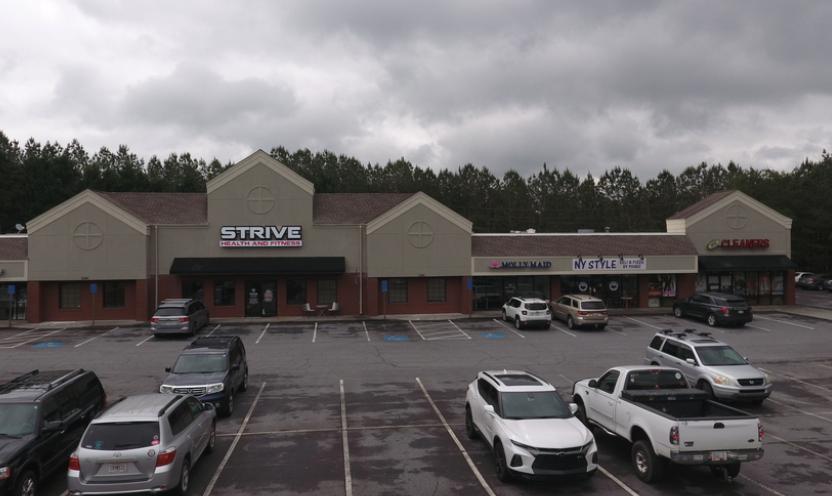
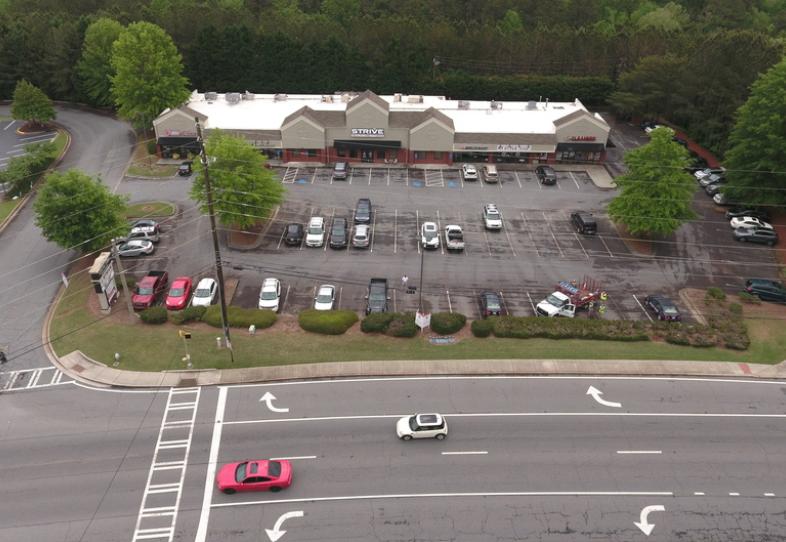
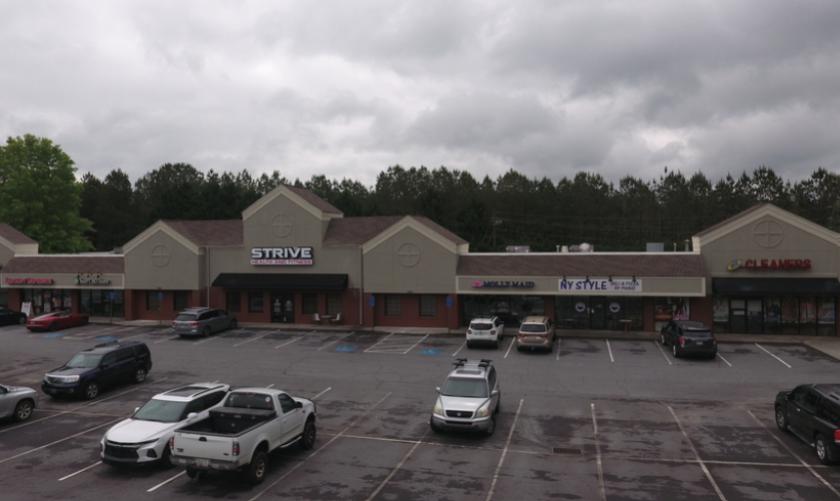
1-Mile | 3-Miles | 5-Miles | ||
---|---|---|---|---|
Total Population | 8,679 | 60,635 | 150,845 | |
Population Median Age | 36 | 37 | 37 | |
Population by Age | 0-9 Yrs | 1068 (12%) | 7447 (12%) | 18662 (12%) |
10-19 Yrs | 1409 (16%) | 9156 (15%) | 21489 (14%) | |
20-29 Yrs | 1260 (14%) | 8373 (13%) | 20752 (13%) | |
30-39 Yrs | 968 (11%) | 7643 (12%) | 20288 (13%) | |
40-49 Yrs | 1381 (15%) | 9222 (15%) | 22500 (14%) | |
50-59 Yrs | 1379 (15%) | 8594 (14%) | 20531 (13%) | |
60-69 Yrs | 661 (7%) | 5743 (9%) | 15322 (10%) | |
70+ Yrs | 553 (6%) | 4455 (7%) | 11301 (7%) | |
Median HH Income | $90,453 | $76,788 | $81,591 | |
Total Household Income | < 24K | 378 (11%) | 3003 (13%) | 6507 (11%) |
25-49K | 482 (15%) | 4021 (18%) | 8645 (15%) | |
50-74K | 410 (12%) | 3791 (17%) | 9713 (17%) | |
75-99K | 516 (16%) | 3625 (16%) | 8583 (15%) | |
100-199K | 1061 (33%) | 6044 (27%) | 17205 (31%) | |
200K+ | 332 (10%) | 1664 (7%) | 3603 (6%) | |
Highest Education Level | No Diploma | 228 | 2908 | 6656 |
Diploma or GED | 888 | 8860 | 21390 | |
Some College | 1317 | 9756 | 23767 | |
Assoc. Degree | 331 | 3002 | 8482 | |
Bachelors Degree | 1896 | 10813 | 28028 | |
Higher Degree | 896 | 4790 | 12209 | |
Total Housing Units | 3,219 | 23,111 | 56,564 | |
--Owner-Occupied | 2,376 | 15,153 | 39,457 | |
--Renter-Occupied | 803 | 6,994 | 14,800 | |
Owner-Occupied Values | < 100K | 46 | 705 | 1382 |
100-199K | 268 | 4054 | 13713 | |
200-299K | 1055 | 5415 | 14278 | |
300-399K | 631 | 2537 | 5708 | |
400-499K | 301 | 1325 | 2317 | |
500K+ | 75 | 1117 | 2060 | |
Total Working Age Population | 6,799 | 47,456 | 118,821 | |
In Work Force | 4,904 | 33,801 | 85,066 | |
Not In Work Force | 1,895 | 13,655 | 33,755 | |
Workforce Employed | 4,722 | 32,632 | 81,832 | |
Workforce Unemployed | 182 | 1,145 | 3,129 | |
Civlian Workforce | 4,904 | 33,777 | 84,961 | |
Military Workforce | 0 | 24 | 105 | |
Total Households | 3,179 | 22,147 | 54,257 | |
Family Households | 2,392 | 15,770 | 39,188 | |
Non-Family Households | 787 | 6,377 | 15,069 | |
Married Couple | 1,909 | 12,564 | 31,137 | |
Other Family | 483 | 3,206 | 8,050 | |
Married w/Child | 865 | 5,819 | 13,744 | |
Single Male w/Child | 112 | 493 | 1,243 | |
Single Female w/Child | 226 | 1,249 | 3,119 |
Population Change Last Two Decades - Plus Projection
2000 | % | 2010 | % | 2020 | % | 2030 | |
---|---|---|---|---|---|---|---|
Georgia | 8,186,453 | +18 | 9,687,653 | +12 | 10,833,472 | +13 | 12,292,423 |
Cherokee County | 141,903 | +51 | 214,346 | +24 | 266,617 | +20 | 320,849 |
Cobb County | 607,751 | +13 | 688,078 | +15 | 790,588 | +19 | 938,747 |
Fulton County | 816,006 | +13 | 920,581 | +19 | 1,099,181 | +18 | 1,300,861 |
Total Working Age Population:
Total Households:
Total Working Age Population:
Total Households:
Total Working Age Population:
Total Households: